If your website visitors are not converting, then obviously, there is something stopping them.
You can go ahead and ask your design team to create new designs, but the question remains: how do you know that the new designs will convert more visitors compared to the original design?
In this article, we’ll cover what is AB testing, why you should consider AB testing, categories of AB tests, what is statistical significance, how to launch an AB test, and many more.
Ready to learn? Let’s get started.
We’ll map your highest-impact experiments.

What Is AB Testing?
A/B testing, also known as split testing, is a method of comparing two versions of a webpage or app against each other to determine which one performs better. It involves testing different elements, such as headlines, images, or buttons, with similar audiences to identify which variant leads to higher conversions, engagement, or other desired outcomes.
ALSO READ: The Difference Between A/B Testing and Multivariate Testing
The original design of a page is usually referred to as the control. The new designs of the page are usually referred to as the “variations,” “challengers,” or “recipes.”
The process of testing which page design generates more conversions is typically referred to as a “test” or an “experiment.”
A “conversion” will vary based on your website and the page you are testing. For an e-commerce website, a conversion could be a visitor placing an order. But, for a SaaS website, a conversion could be a visitor subscribing to the service. For a lead generation website, a conversion could be a visitor filling out a contact form.
How Is AB Testing Performed?
From the definition of A/B testing, you already know that A/B testing works by comparing two different versions of something, like a webpage or an app screen, to see which one people like or respond to better.
Here is an A/B testing example that will help you understand:
Imagine you have a homepage on an e-commerce website that receives 100,000 visitors a month. To determine if there is a way to increase conversions, the design team creates one new design for the homepage.
AB testing software is then used to randomly split the homepage visitors between the control and the new challenger. So, 50,000 visitors are directed to the control, and 50,000 visitors are directed to the challenger.
Since we are testing which design generates more orders (conversions), we use the AB testing software to track the number of conversions each design generates. The A/B testing software will then determine the winning design based on the number of conversions.
What Is The Main Purpose Of AB Testing?
A major challenge eCommerce businesses face is the issue of a highcart abandonment rate.
This is bad for a business because it usually signals that the customer is not happy with something.
This is where the A/B test shines because it allows you to make the most out of your existing traffic without spending extra cash on acquiring new traffic.
Here are more reasons why you should conduct A/B tests:
1. Reduces bounce rates:
There is nothing more painful than working on your site design, making it public, and realizing site visitors are not engaging with your content.
Many eCommerce sites are facing this issue. As a business, if you want to prevent this from happening, before rolling out new designs, create an A/B test and let your variation be the new site design against your present design (control).
Split your traffic using a tool like Figpii across the control and design and let your users decide.
This is one of the advantages of running A/B tests. It prevents you from launching untested new designs that could fail and dampen your revenue.
2. Reduced cart abandonment rates:
One of the major plagues eCommerce stores faces is cart abandonment.
This means site visitors and customers add an item(s) to the cart and don’t complete the checkout process.
How A/B tests help you here is simple. There are important elements on the product checkout page, like the check-out page text, where shipping fees are located, etc.
By creating a variation and playing with the combination of these elements and changing their location, you can see which of the pages (control or variation) helps to decrease the cart abandonment rate.
Without A/B testing your redesign ideas, there’s no guarantee that it’s going to improve cart abandonment rates.
3. Increased conversion rates:
If you’re seeing a decent conversion rate with A/B testing, you can increase your conversion percentage.
You can A/B test page layout, copy, design, location of the CTA button, etc.
Without A/B tests, if you should make a design change or copy change, there’s no guarantee that there will be improvements.
4. Higher conversion values:
The learnings you get from an A/B test on one of your product pages can be implemented or modified on the product pages of more expensive products.
This goes a long way in improving your customer AOV and your revenue bottom line.
What Are The Different Types Of A/B Testing?
AB tests come in different types, and they can be done in different environments.
1. A/A Test:
An A/A test is a control test where two identical versions of a webpage are compared. It’s done to ensure the testing process is working correctly. For example, in an A/A test, both version A and version A’ of a webpage are shown to users simultaneously. If the results show significant differences between these identical versions, it suggests a problem in the testing setup.
2. A/B Test:
A/B testing involves comparing two versions of a webpage (A and B) to determine which one performs better. For instance, in an e-commerce A/B test, version A might have a green “Buy Now” button, while version B has a red one. By analyzing user interactions, businesses can identify the color that leads to higher click-through rates and conversions.
3. A/B/n Test:
A/B/n testing expands on A/B testing by comparing multiple versions of a webpage (A, B, C, etc.). For example, an online news platform might test different headlines (A, B, C) simultaneously to see which one attracts more clicks, providing insights into user preferences among multiple options.
4. Multivariate Test:
Multivariate testing involves testing multiple variations of different elements within a webpage. For instance, a travel website could test various combinations of images, headlines, and call-to-action buttons on its homepage to find the optimal mix that increases user engagement and bookings.
5. Targeting Test:
Targeting tests involve showing different versions of a webpage to specific audience segments. For example, an online clothing store might show different homepage versions to new visitors, returning customers, and newsletter subscribers, tailoring the user experience based on their preferences and behaviors.
6. Bandit Test:
Bandit tests, also known as Multi-Armed Bandit tests, dynamically allocate traffic to the best-performing versions during the testing period. For instance, an online gaming app might use a bandit test to optimize the display of in-game ads, ensuring that the most effective ad is shown more frequently to maximize revenue.
7. Split Page Path Test:
Split page path tests involve testing different user journeys or paths within a website. For example, an e-learning platform could test two different pathways for users to access course materials: one through a step-by-step guide and another through a video tutorial. By comparing user engagement and completion rates, the platform can optimize the learning experience based on the preferred path.
It’s important to mention that each and every type of experiment listed can provide reliable data that can be used to attain valuable insights.
How To Launch An A/B Test
Below is a simple and straightforward process you can begin using to perform an A/B test.
1. Research and analyze data:
Collecting quantitative and qualitative data is key in knowing what to A/B test.
With the user behavior insights you gather from going through your site analytics and the results from qualitative research, you’ll easily find out the major causes of user frustration on your site.
One qualitative research method I recommend is analyzing heat maps and session recordings. This way, you can easily see visitor behavior data – where they click, scroll depth, etc., all give you ideas for future tests.
With tools like Google Analytics 4, you’re able to track the pages that have the highest bounce rates and least user activities. These are pages you can improve.
2. Form hypothesis:
Now you’ve gone through your analytics, you’ve seen the pages that can be improved, your qualitative results are back, and you’ve seen and heard from your customers about their experiences.
It’s now time to create a test hypothesis. An effective A/B testing hypothesis consists of three key components:
- Identify a clear problem or challenge.
- Offer a precise solution to address the problem.
- Describe the expected impact of the solution.
Here is an example of a solid AB testing hypothesis:
Certain customers abandon their shopping carts due to a lengthy checkout process (challenge). Simplifying the checkout form by reducing the number of required fields (specific solution) is expected to increase the conversion rate by 20% (assumed impact).
3. Create variation:
Using an A/B testing tool like FigPii, you can easily create the variation of the page you want to test. You can also make changes to the element you want to focus on. This might be changing the color of a button, changing out the copy hiding the navigation, etc.
4. Run the test:
It’s time to run the experiment. Your A/B testing software will randomly allocate your site visitors based on the percentage you provided. Their interaction with the control or variation is recorded and computed, which determines how either is performed. It’s important to mention that you should never stop your test until it hits the required sample size and achieves statistically significant results.
5. Analyze the result:
When your experiment is over, it’s time to look at the results and see how the control and variation performed.
This is a crucial stage because a lot can be learned from a winning and losing test.
Your A/B testing tool will show you how each performed and if there’s a statistical difference between the two.
What is Statistical Significance
If you ask any conversion rate experts, they will probably recommend that you don’t stop before it reaches statistical significance.
You can think of statistical significance as the level of certainty that your test results are not affected by a sample size error or any other factor. As a rule of thumb, an A/B test should have statistically significant results of 90% (and above) for the change to impact the performance of a website.
The amount of traffic coming into a landing page you’re testing will determine how long it takes to reach statistical significance. The higher the traffic, the faster it would take – and vice-versa.
E-commerce AB Testing Case Studies
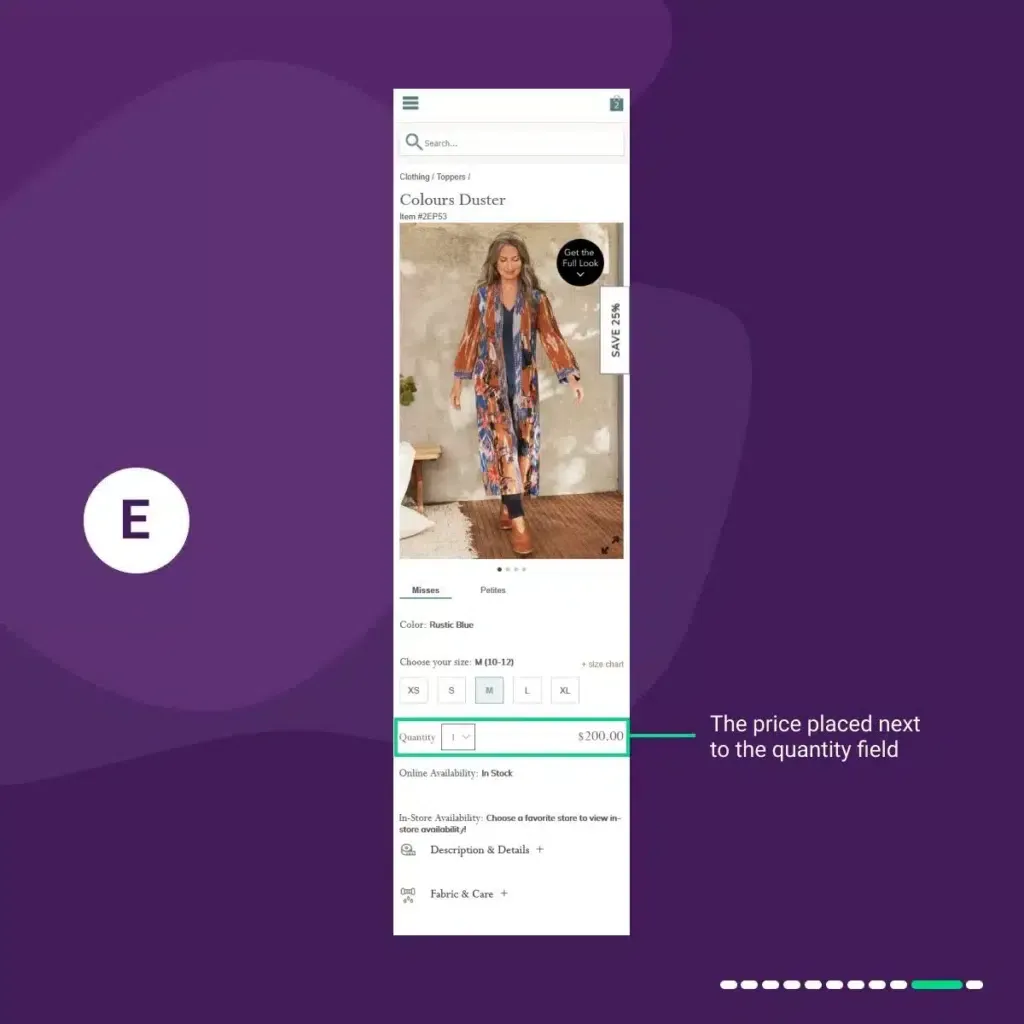
In this case study, we tested if the price placement on the PDP was the reason behind the decline in conversions.
We decided to go ahead and test placing the price in different areas in the PDP and see how it would impact conversions.
In the control “A”:
The price was placed at the top of the page above the product image.
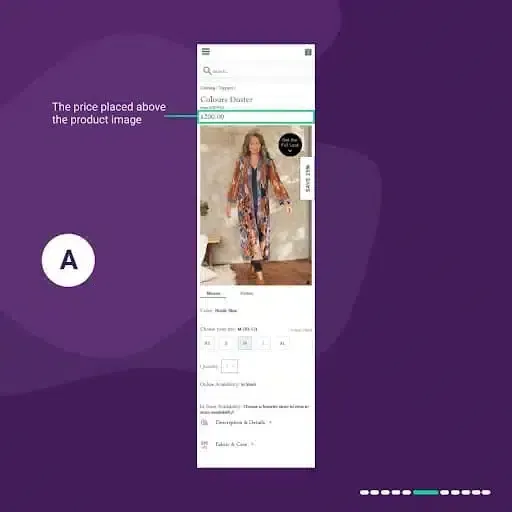
When visitors reached the “add to cart” CTA at the bottom of the PDP, they had to go all the way up to see the price. It caused friction and made them abandon the page.
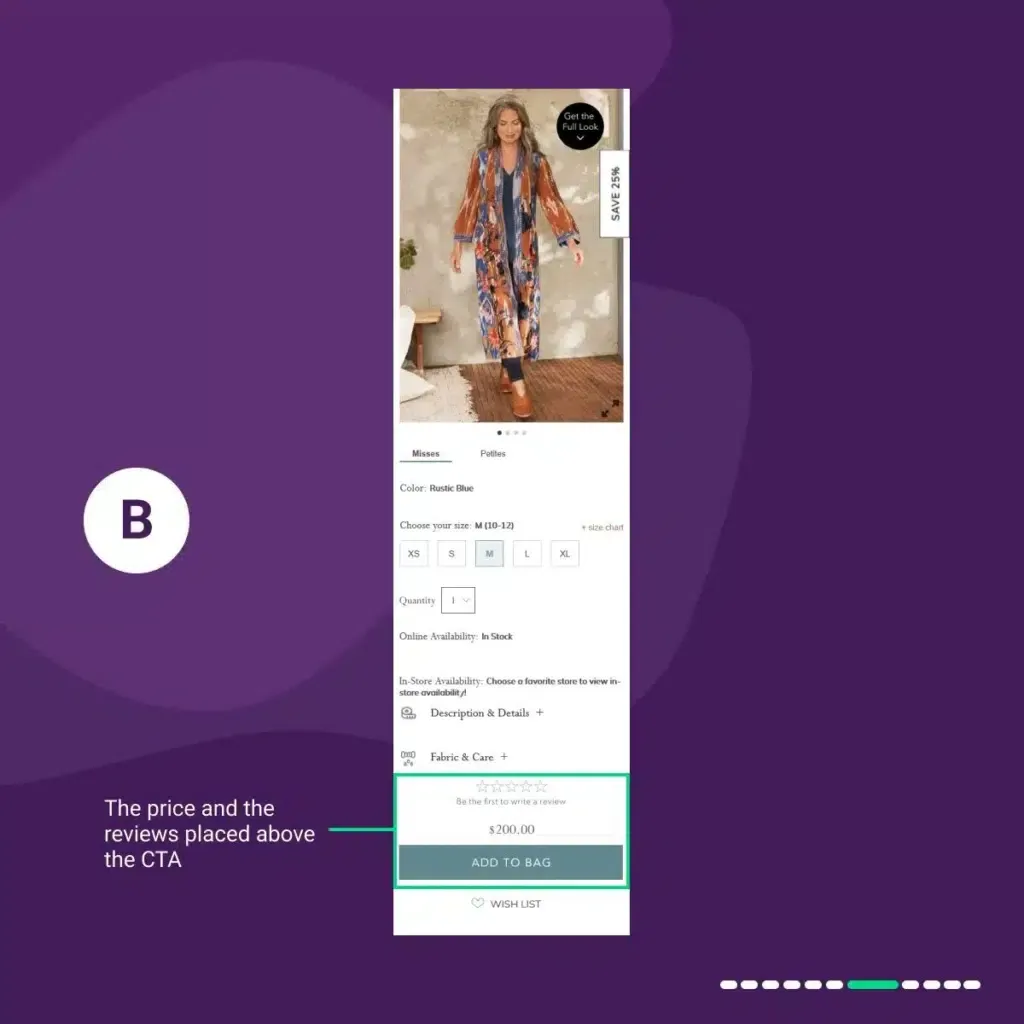
In variation 1 “B”:
We placed the price and the reviews above the “add to bag” CTA.
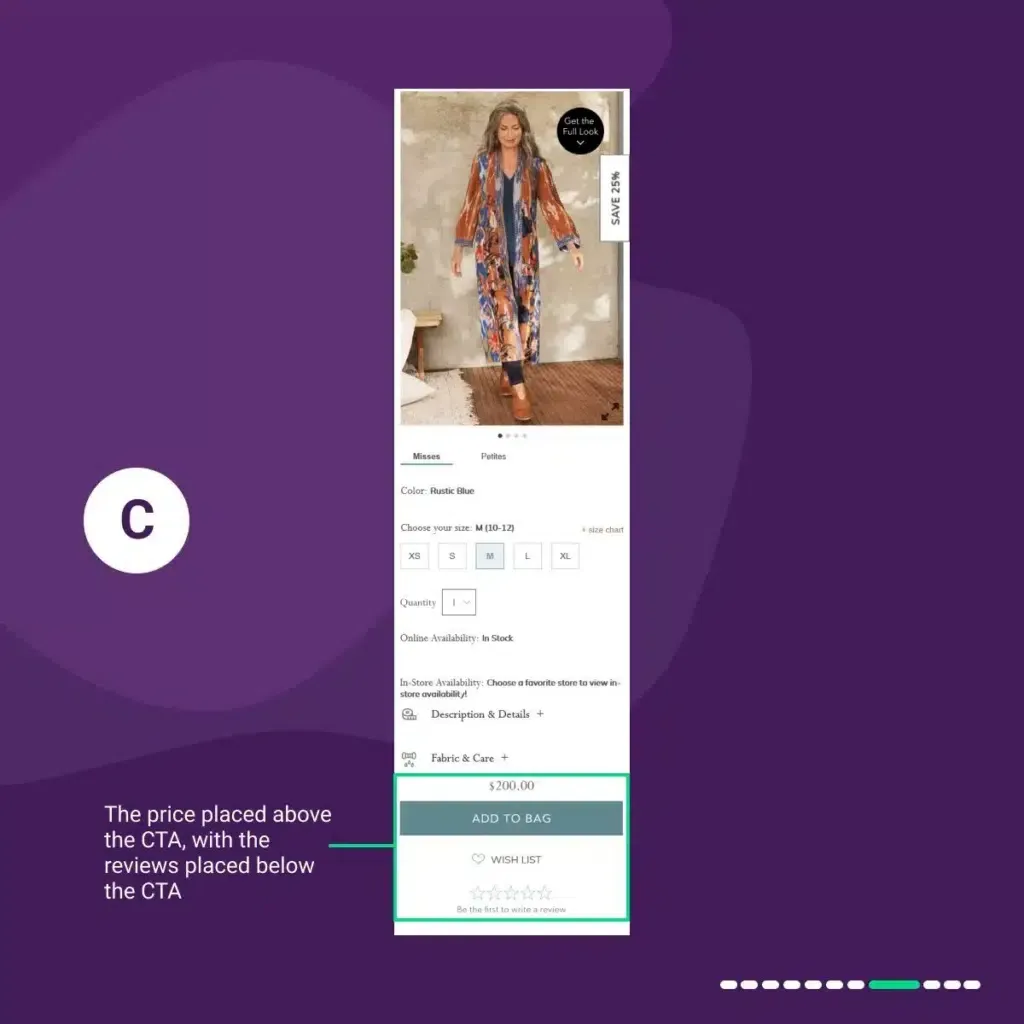
In variation C:
We placed the price above the “add to bag” CTA, with the reviews below the CTA.
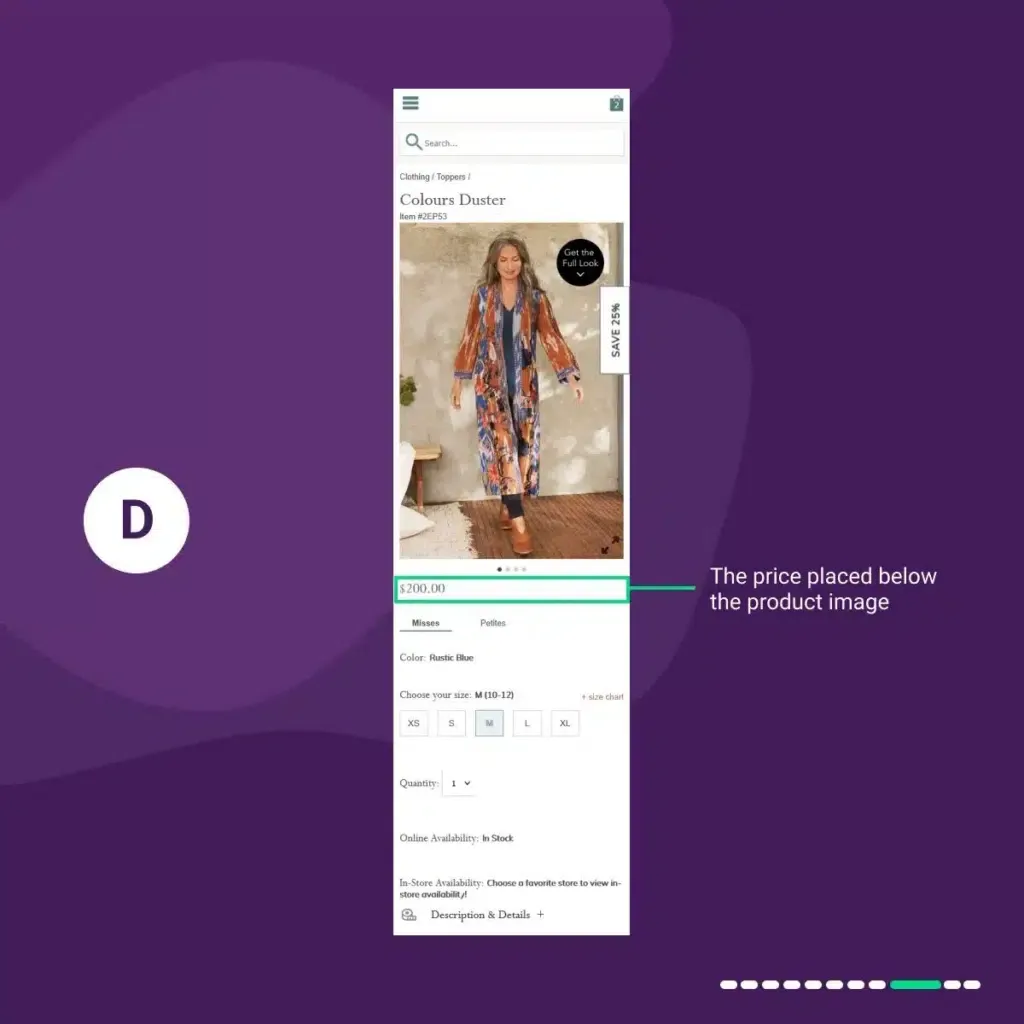
In variation 3 “D”:
We placed the price below the product image.
In variation 4 “E”:
We placed the price next to the quantity field.
Results:
Variation 1 “B” uplifted conversions by 3.39%.
Then Variation 2 “C” outperformed the original and the other variations by a 5.07% uplift in conversion rate.
Variation 3 “D” uplifted conversions by 1.27%.
And Variation 4 “E” uplifted conversions by 0.95%.
Takeaways:
While the price is simple and obvious, you should not overlook how a product’s price is displayed on your PDPs. Important elements such as price deserve consideration in an e-commerce design.
Don’t assume that the current placement of your elements is the best for your users.
You still need to test it and see what resonates best with them.
We did it and got a 5.07% uplift.
How does the A/B Testing Software Determine the Winning Design?
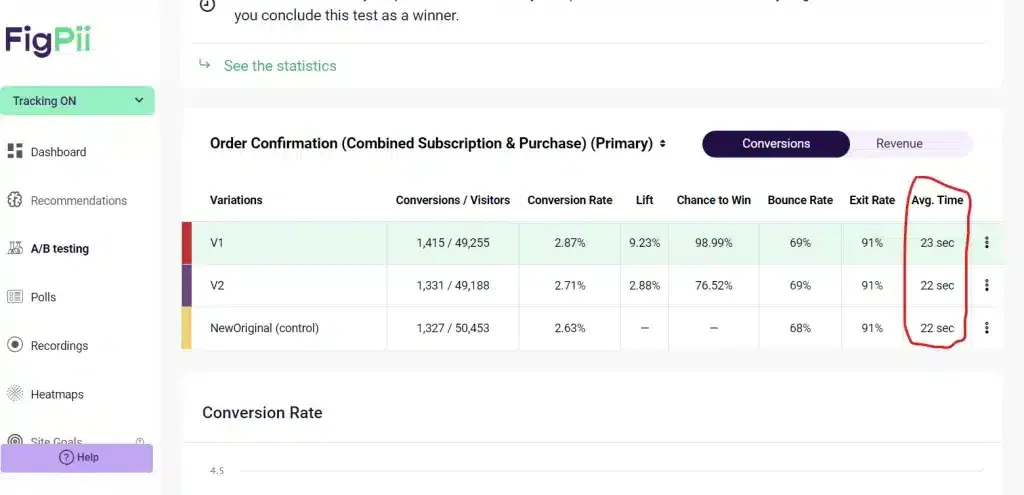
At its core, AB testing software tracks the number of visitors coming to each design in an experiment and the number of conversions each design generates. Sophisticated A/B testing software tracks much more data for each variation. As an example, FigPii tracks:
- Conversions
- Pageviews
- Visitors
- Revenue per visit
- Bounce rate
- Exit
- Revenue
- Source of traffic
- Medium of traffic
The split testing software uses different statistical modes to determine a winner in a test. The two popular methods for determining a winner are Frequentist and Bayesian models.
The split testing software tracks conversion rates for each design. However, declaring a winner in a split test requires more than generating a small increase in conversion rates compared to the control.
The Frequentist Model
This model uses two main factors to determine the winning design:
- The conversion rate for each design: this number is determined by dividing the number of conversions for a design by the unique visitors for that design.
- The confidence level for each design: a statistical term indicating the certainty that your test will produce the same result if the same experiment is conducted across many separate data sets in different experiments.
Think of confidence level as the probability of having a result. So, if a challenger produces a 20% increase in conversions with a 95% confidence, then you assume that you have an excellent probability of getting the same result when selecting that challenger as your default design. It also indicates that you have a 5% chance that your test results were due to random chance and a 5% possibility that you found a wrong winner.
The Bayesian Model
This approach uses two main factors to determine the winning design:
- The conversion rate for each design is as defined above.
- Historical performance: the success rate of previously ran A/B experiments on the web page.
Leonid Pekelis, Optimizely’s first in-house statistician, explains this by saying.
Bayesian statistics take a more bottom-up approach to data analysis. This means that past knowledge of similar experiments is encoded into a statistical device known as a prior, and this prior is combined with current experiment data to make a conclusion on the test at hand.
We typically rely on multiple metrics when determining a winning design for a test. Most of our e-commerce clients use a combination of conversion rates and revenue per visit to determine a final winner in an experiment.
Selecting which metrics will depend on your specific situation. However, it is crucial to choose metrics that have an impact on your bottom line. Optimizing for lower bounce or exit rates will have little direct and measurable dollar value to most businesses.
The team at Bing was trying to find a way to increase the revenue that the site generates from ads. To do so, they introduced a new design that emphasized how search ads are displayed. The team tested the new design vs. the old design. The split test results showed a 30% increase in revenue per visit.
This, however, was due to a bug in their main search results algorithm in the new design. This bug showed visitors poor search results. And as a result, visitors were frustrated and were clicking on ads.
While the new design generated a higher revenue per visit, this was not a good long-term strategy. The team decided to stick to the old design instead.
Assigning weighted traffic to different variations
Most AB testing software automatically divides visitors equally between different variations.
There are, however, instances where you need to assign different weights to different variations.
For example, let’s take an experiment that has an original design and two challengers in it. The testing team might want to assign 50% of the visitors to the original design and split the remaining 50% between variations one and two.
Should you Run AB Testing on 100% of Your Visitors?
Get a free conversion assessment.
Some Conversion optimization experts debate this question at great lengths.
Looking at your analytics, you can typically notice that different visitor segments interact differently with your website. Returning visitors (those who visited the site previously) generally are more engaged with the website compared to new visitors.
When launching a new AB test, you will notice that in many instances:
- New visitors react in a better way with your experiment challengers.
- Returning visitors, who are used to your current design, react negatively to your new designs.
The fact that new visitors convert at higher rates with new designs compared to returning visitors is attributed to the theory of momentum behavior.
If your website gets a large number of visitors, we recommend that you launch new tests for only new visitors and observe how they react to it. After that, you can start the test for returning visitors and compare their reactions to the new designs introduced in the experiment.
Alternatively, you can also launch the test for all users and then segment the results post-test based on new/returning users too, instead of treating them as two different tests. This is the preferred method used by most conversion rate experts.
AB Testing Mistakes To Avoid
A/B testing takes time to plan, implement, and get learnings from the result. This means making mistakes is not something your business can afford because it can set you back in revenue and time-wise.
Below are some A/B mistakes you want to avoid as a business.
1. Running a test without a hypothesis:
Seasoned experimenters know not to test anything without having a hypothesis for it. An A/B test hypothesis is a theory about why you’re getting a result on a page and how you can improve it.
To form a hypothesis, you’ll need to pay attention to your site analytics and see the important pages that are getting lots of traffic but have a low conversion rate or the pages that are getting loads of traffic and have a high bounce rate.
Then you go ahead and form your hypothesis about why you think it’s happening and what changes can be made to see a lift in conversions.
Going straight to create an A/B test, skipping the step of insight gathering (qualitative and quantitative), and forming a hypothesis could have a negative impact on your site’s conversion rate.
2. Copying others blindly:
In CRO, it’s bad practice to copy your competitor’s design because they saw a 46% uplift in their conversion rate.
The reason for this is that implementing a site redesign or page design without knowing about the hypothesis and what was being tested could radically impact your bottom line and user experience.
But there’s a walk around this. If you’re just starting out with A/B testing, or you’ve been doing it for a while, and you see your competitor has seen good conversion from an A/B test, instead of going ahead to implement the same changes they made on their website, you could use their now control page as a variation in A/B test against your current design.
This is a safe way to go about it and get learnings without fully redesigning your site or a page and without destroying your bottom line and user experience.
3. Changing parameters mid-test:
One absolute way to mess up your A/B test is by changing your testing parameters midway.
This messes up your results.
Parameters you can mess up;
- Changing the allocated traffic mid-way.
- Changing your split testing goals.
Note: Changing your testing parameters spoils your results. If you must change something, start the test again.
4. Not allowing the test to run fully:
You observe your A/B test running, and your gut tells you that the variation leading is good enough to stop the test.
This is a mistake. The experiment must be allowed to run to achieve statistical significance. This is the only way the results can’t be declared invalid.
5. Using tools that impact site performance:
As A/B testing becomes more popular, a lot of cheap and low-cost tools are flooding the market. Running your A/B tests with such tools, you run the risk of impacting your site performance negatively.
The fact is, both Google and your site visitors want your website to load fast, but some A/B test software creates an additional step in loading and displaying a page.
This leads to the flicker effect, also known as the Flash of Original Content (FOOC), where for some seconds, the site visitor gets to see the control page before the variation appears.
This leads to a bad user experience, which slows the page load time, which ultimately impacts conversions because site visitors are known not to be patient.
Holdback Split Testing
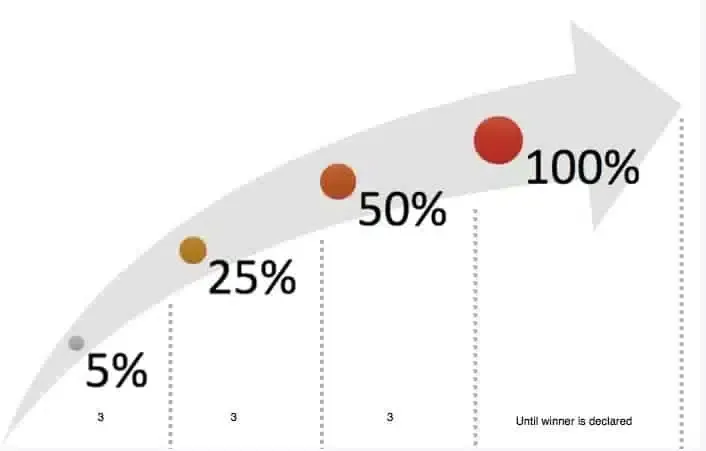
We typically recommend running holdback split tests for larger websites that receive thousands of conversions per month. In these types of tests, you launch the tests to a small percentage of your site visitors. For example, you start with launching the test to 10% of your visitors. If the results are encouraging, then you expand the test to 25%, 50%, and 100% of your website visitors.
There are several advantages to running hold-back A/B tests:
- Discover any testing bugs: As you launch an AB test, your designs might have bugs in them. By running the test on a small percentage of your visitors, only that tiny segment of the visitors will see the errors in the new designs. That will give you the opportunity to fix these bugs before rolling out the test to 100% of your visitors.
- Reduce revenue risk: by running the test on a small percentage of visitors, you reduce the risk of having one of your test variations causing a significant drop in revenue.
If you choose to run hold-back A/B tests, make sure that you start a new test each time you change the traffic allocation going through the experiment to avoid any statistical problems with the results.
How Many Variations Should you Include in An AB Test?
There is a lot of math that goes into determining how many variations should be included in an A/B test. The following are general guidelines you can apply. However, more details will be covered in a later section:
Calculate the monthly number of conversions generated by the particular page you plan to test:
- On the conservative side, divide the total monthly conversions generated by the page by 500 and subtract one.
- On the aggressive side, divide the total monthly conversions generated by the page by 200 and subtract one.
If you have less than 200 conversions a month, your website is not ready for A/B testing. Focus on driving more visitors to your website.
Example: Your website generates 1,000 conversions per month:
- On the conservative side, an A/B test can include one challenger against the original (1000/ 500 – 1)
- On the aggressive side, an A/B test can include four challengers against the original (1000/ 200 – 1)
Again, this is a simplification of the calculation, but it will give you a good starting point.
More Conversion Rate Optimization Resources
Keep reading to find out more and learn more in the following chapters about A/B testing…
AB Testing Best Practices: Optimize your strategies with AB testing best practices – unlock insights, enhance user experience, and boost conversion rates for maximum business success.
AB Testing Process: Unlock the power of AB Testing Process: streamline experimentation, enhance decision-making, and drive optimal outcomes for your business.
AB Testing Tools: Discover top AB Testing Tools: streamline experimentation, optimize user experience, and drive conversions for business success.
AB Testing Vs. Multivariate Testing: Navigate the testing landscape with insights on AB Testing vs. Multivariate Testing – choose the right strategy for optimal results in experimentation.
AB Testing Results Analysis: Master the art of AB Testing Results Analysis: uncover actionable insights, refine strategies, and elevate your experimentation game for business success.
AB Testing Velocity: Accelerate growth with AB Testing Velocity: optimize iteration speed, enhance decision-making, and propel your experimentation strategy to new heights.
Frequently Asked Questions
What Is A/B Testing?
AB testing, also known as split testing, compares two versions (A and B) of a webpage or marketing element to analyze user behavior and determine which version performs better in achieving specific goals, such as improving the conversion rate or click-through rate.
How do I choose the right elements for A/B testing?
Focus on elements like landing page layout, ad copy, and subject lines that directly impact user engagement. Identify specific challenges in your marketing campaign to formulate effective hypotheses for testing.
Why is statistical significance important in AB testing?
Statistical significance ensures that the differences observed in test results are not due to chance. It provides reliable data by confirming whether the changes observed in user behavior or website visitors are statistically significant results, not random fluctuations.
How do I determine the sample size for A/B testing?
Calculating an appropriate sample size is crucial. Use statistical methods to ensure the data collected is robust and representative of your target audience. Tools like Google Analytics can assist in understanding your visitor behavior data and guide your decisions.
Can A/B testing be applied to multiple pages of a website?
Yes, A/B testing can be conducted on multiple pages. Analyze user interactions across various pages to gain quantitative user insights. Ensure to maintain the same user experience consistency to achieve accurate results.
How long should I run an A/B test to collect sufficient data?
Run the test until you achieve statistical significance. Factors like landing pages, test results, and user behavior impact the duration. Larger changes might show results quickly, while subtle ones require longer durations to gather enough data for analysis.
What role does A/B testing play in improving my marketing campaign’s ROI?
A/B testing helps optimize your marketing campaign elements, such as ad copy and landing page, leading to improved conversion rates. By identifying the most effective strategies, you can enhance user engagement and ultimately boost your ROI.