A/B testing is essential for Conversion Rate Optimization (CRO). Popular sites like Google and Amazon use it to optimize their website elements. While many companies use A/B testing, analyzing the results can be complex.
One small mistake can lead to incorrect conclusions and lost conversions.
This article will guide you through analyzing A/B test results and statistically significant results, regardless of the tool you use.
We’ll map your highest-impact experiments.

Defining A/B Testing
A/B testing, or split testing, involves comparing two versions of a web page or email to determine which version generates more conversions.
Let’s say you’re running a lemonade stand and figuring out how to get people to buy your refreshing drinks. You could try two different signs: one that says “Ice-Cold Lemonade” and another that says “Freshly Squeezed Lemonade.”
This is the essence of A/B testing: you create two versions of something (in this case, your sign) and see which performs better.
In the digital world, this “something” could be anything from a website’s headline to the color of a button. You show one version (version A) to half of your visitors and another version (version B) to the other half. Then, you track which version leads to more clicks, purchases, or whatever goal you’re aiming for.
Real-World A/B Testing Case Study
Let’s examine a real-world example to see how A/B testing works in action and what makes it so powerful.
Our CRO team noticed a dip in conversions on one of our client’s product detail pages (PDPs) and suspected that the price placement might be causing friction for potential customers.
We decided to run an A/B test with different price placements to get to the bottom of this.
In version A (Control, we placed the price at the top of the page above the product image.

When visitors reached the “add to cart” CTA at the bottom of the PDP, they had to go up to see the price. It caused friction and made them abandon the page.
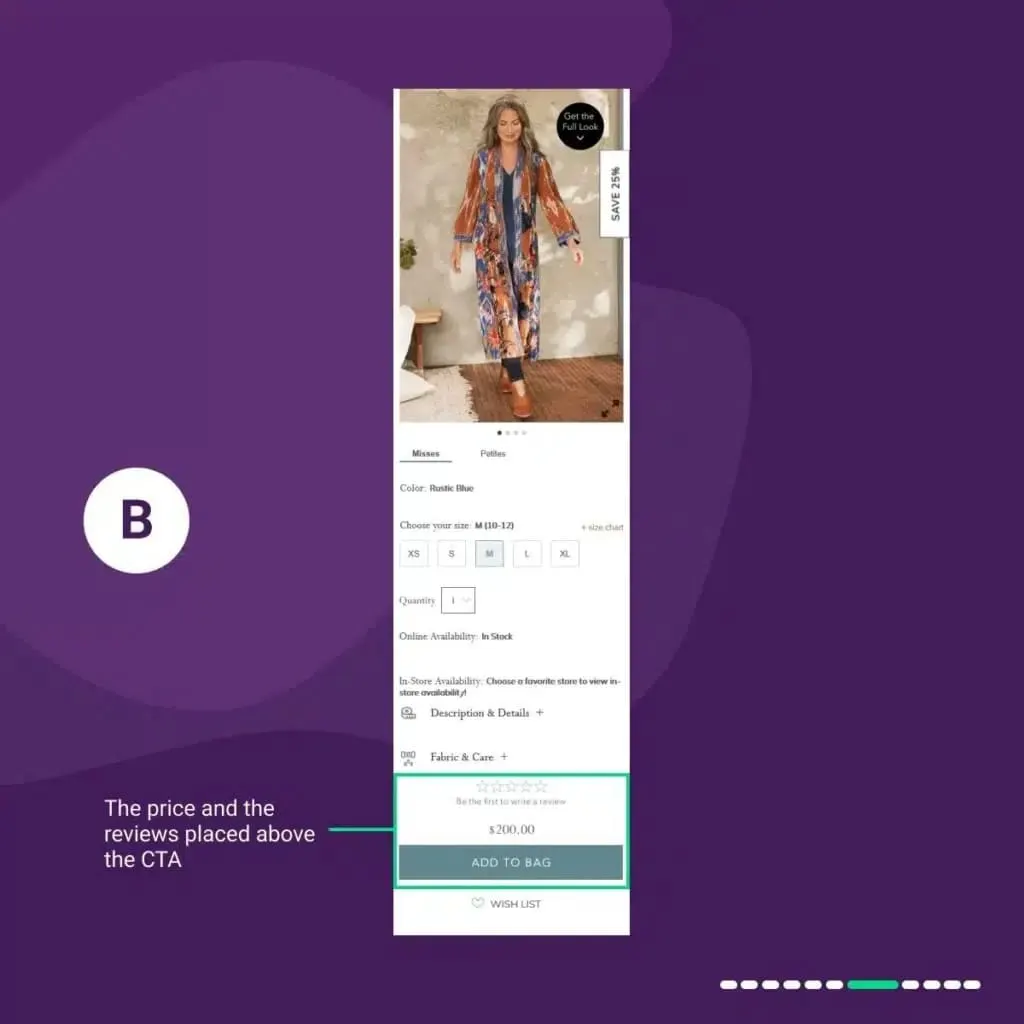
In variation 1 “B,” We placed the price and the reviews above the “add to bag” CTA.
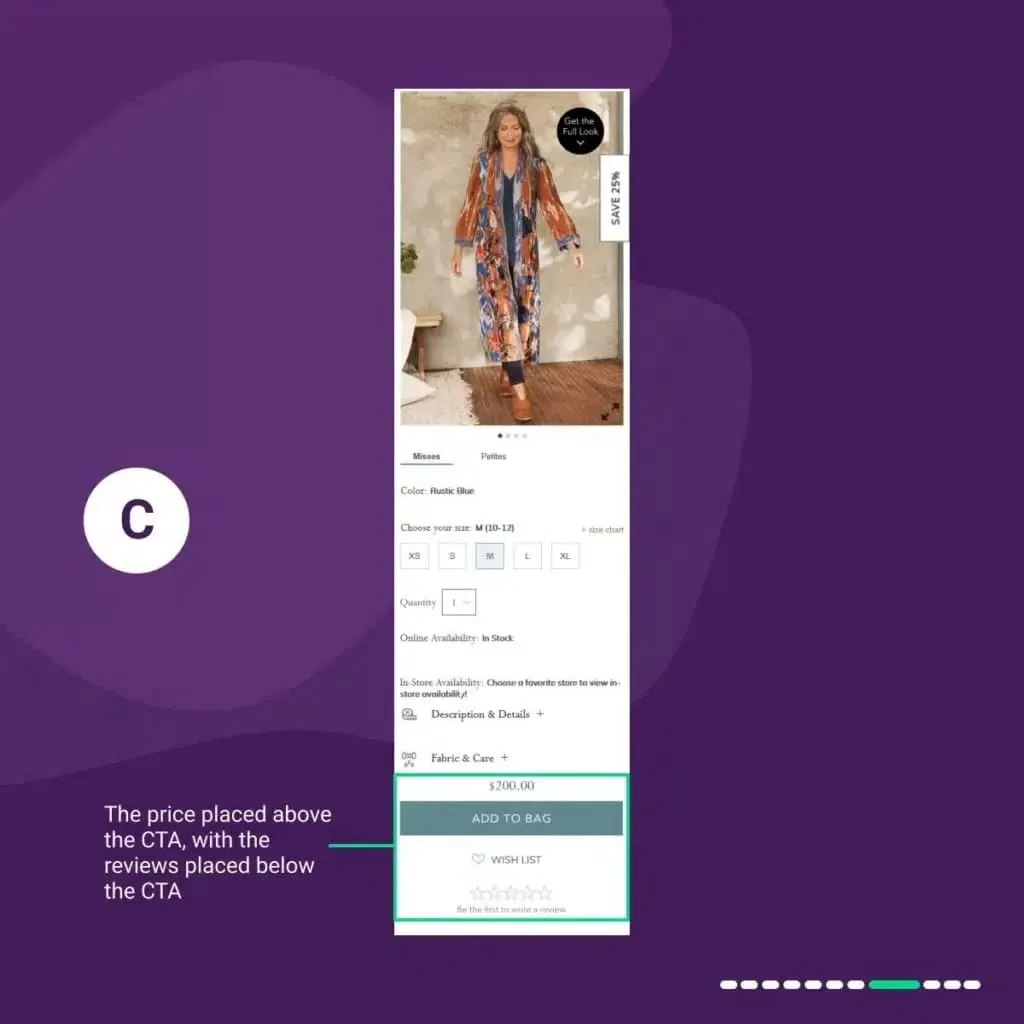
In variation C, we placed the price above the “add to bag” CTA and the reviews below.
In variation “D,” We placed the price below the product image.

In variation 4 “E,” We placed the price next to the quantity field.

The results were quite eye-opening:
- Version B increased our conversions by 3.39%.
- Version C outperformed all other versions, boosting our conversions by 5.07%.
- Version D saw a 1.27% uplift.
- Version E had a modest 0.95% uplift.
What did we learn from this?
- Even seemingly simple elements like price placement can significantly impact conversions.
- We shouldn’t assume our current design is the best. It’s essential to consistently conduct A/B tests to see what resonates with our users.
By testing and making data-driven decisions, we achieved a 5.07% uplift in conversions, a considerable improvement that can translate into significant revenue growth for our business.
To know more about A/B testing and how to conduct A/B tests, you should read ourin-depth guide to A/B testing.
How To Analyze A/B Test Results
Congratulations, your test won!

So, what’s next? Should you permanently remove the old design and ask your developers to implement the winning variation?
No, not yet!
Before you do that, you must ensure your results are correct. This means you must investigate and know the factors contributing to the win. Remember,A/B testing is not about running testsand hoping for wins. It’s also about learning.
Identifying the Outcome
You’ve run your A/B test, and now you get to see what happened. There are a few possible scenarios:
Scenario 1: One Winning Variation:
What it means: One of your variations has outperformed the original (control) version. This is typically determined by reaching a pre-set level of statistical significance (more on that later).
For instance, you tested the control against three variations (V1, V2, and V3), and V2 won.
The next thing you should do is re-run the test; this time, you should only test the control vs. the winning variation (V2, in this case).
If the initial results are correct, V2 will win again, and you can draw some learnings that you can propagate across the site.
You should also consider allocating 100% of the traffic to the winning variation. This means pausing the experiment, duplicating it, and resetting the traffic allocation.
Scenario 2: Multiple Winning Variations:
What it means: Sometimes, depending on how reasonable yourdeveloped hypothesiswas, more than one variation can outperform the control, but it needs to be clarified which one is the absolute best.
As good as it might sound, it can be confusing—in the sense that you might not know which variation to go with.
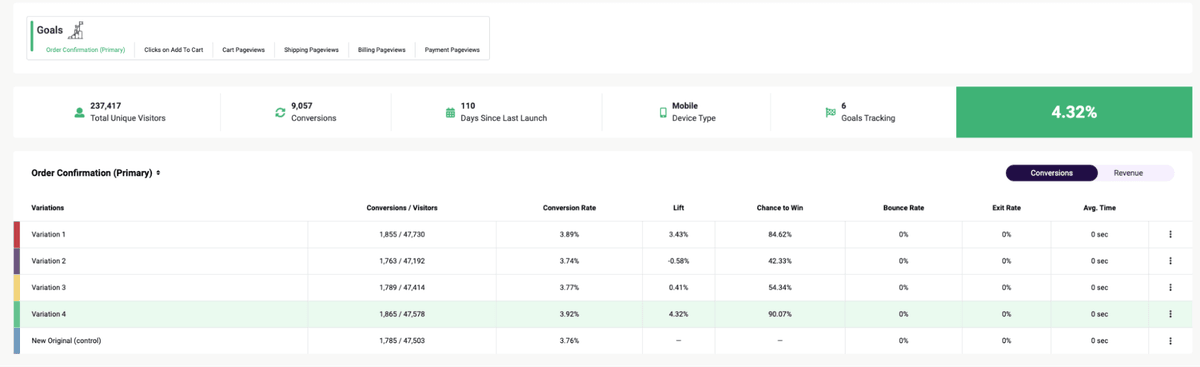
Look closely at the data to see if there are subtle differences between the winning variations. Is one slightly better in terms of conversions or engagement?
Looking at the above screenshot, it’s easy tochoose variation four in such casesbecause it is thehighest-winning variation.But is ignoring other winning variations (1 and 3) a good idea?
To gain insights into how your most valuable customers respond to the changes, segment your test results by:
- Traffic source
- Visitor type (new vs. returning)
- Browser type
- Device type (test mobile and desktop devices separately to see which one performs better than the other)
This can reveal how different user groups respond to changes.
For instance, let’s say yours is a lead generation website, and you’re trying to test multiple variations of trust signals.
- In Variation 1, you use the word ‘guarantee’ in your main headline and notice a 35% uplift in conversions.
- In Variation 2, you include customer testimonials below the fold of the page you’re testing and see a 31% increase in conversions.
- In Variation 3, you add membership trust signals and trust by association and get a 38% uplift in submissions.
All V1, V2, and V3 are winners and showed an uplift in conversions.
In such cases, you can combine all the winning ideas into a single design you will implement on the site.
Scenario 3: Losing Variations:
What it means: None of your variations performed better than the original version.
Don’t despair—even “losing” tests provide valuable insights.
AnA/B test can failwhen the variation(s) running against the control fails to beat the control design in terms of the primary and other goals set in the test. A good example is when the control/original version gets more conversion uplifts than the variation(s).
This can happen even if you follow all theA/B testing best practicesand correctly run the test.
When your test loses, you should:
- Evaluate the solutions you had in your variations.
- Go through your test hypothesis.
- Revalidate your research data.
Here is what I mean by this:
Evaluate the solutions you had in your variations:
Often, the solution you present in an A/B test is the most likely element to need to be corrected.
This is because solutions can be subjective, with multiple variables like location, copy, look, and UX. Most tests focus on evaluating solutions, as the underlying problem and research are usually thorough.
First and foremost, most tests run at Invesp are evaluated from a solutions standpoint. The reason for this is typically the problem uncovered, and the research conducted was thorough. The hypothesis is highly based and driven by data. The solution is the part that can be more prone to human assumptions.
Remember: a single hypothesiscan have multiple solutions. Even logically sound solutions during design discussions may not resonate with site visitors. If a test fails, reconsidering discarded solutions can be beneficial.
For instance, let’s say a hypothesis has four possible solutions:
- Change the placement of the form from below to above the fold
- Use videos instead of text
- Multi-step form instead of a single form
- Use a short copy instead of a long one
Because they want to learn which web element had the most impact onincreasing conversions, optimizers sometimes test only all the possible solutions in a single test. In this case, the first test may aim at solutions 1 and 2. If the test has no positive results, once-discarded solutions 3 and 4 are tested.
Go through your hypothesis:
In A/B testing, a hypothesis predicts how a change will affect conversion rates.
If your test results don’t turn out as expected, your hypothesis might be incorrect. This could happen if your prediction based on the data were wrong or if the data supported multiple predictions.
For example, if visitors aren’t clicking your CTA button, increasing its size might not help if the issue is the button’s placement or uncompelling copy.
Test failures can also occur if your variations aren’t based on a hypothesis. Testing random ideas with proper research is a good use of resources. Instead, conduct thorough research, formulate a solid hypothesis, and design your test accordingly.
Revalidate your research data:
In CRO, we use both qualitative and quantitative data. Validating both types is crucial before launching an A/B test. This involves confirming qualitative findings with quantitative data or vice versa.
For example, if Google Analytics shows a high bounce rate on a page, watching session replays can reveal the cause.
We can approach data revalidation in two ways:
- Qualitative first: Understand user behavior on your site, then confirm with quantitative data. For instance, if session replays show users hesitating to click a CTA button, check the button’s click rate.
- Quantitative first: Start with quantitative data (like low click-through rates), then use qualitative data (like user tests) to understand why.
When an A/B test fails, revalidating your research data is essential. If you initially used one approach, try the other for a different perspective. Ideally, utilize both approaches to gain a comprehensive understanding of the problem on your site.
Interpreting A/B Test Results
Finally, it’s time to analyze your A/B test data.
When interpreting the results of your A/B test, there is a validity checklist you should tick to avoid false positives or statistical errors. These factors include:
- Sample Size
- Significance level
- Test duration
- Number of conversions
- Analyze external and internal factors
- Segmenting test results (the type of visitor, traffic, and device)
- Analyzing micro-conversion data
It makes no sense to conclude any A/B test results without verifying their validity.
So, here’s a detailed insight into each factor you should consider when analyzing A/B testing results.
1. A/B Test Sample Size
Whether you are running the A/B test on a low or high-traffic site, your sample size should be big enough to ensure that the experiment reaches a significant level. The bigger the sample size, the lesser the margin of error.
Tocalculate the sample size for your test, you will need to specify the significance level, statistical power, and the relevant difference between the rates you would like to discover. If the formula is too complicated, there are easy-to-use online sample size calculators.
If you do not calculate your test’s sample size, you risk stopping it too early before it collects enough data.Khalid wrote an articleabout this and had this to say about sample size:
“Any experiment that involves later statistical inference requires a sample size calculation done BEFORE such an experiment starts. A/B testing is no exception.”
Also, consider the following when evaluating the sample size:
- If you’ve already started your test, check if the sample size validates your results.
- Stopping the test prematurely can lead tofalse positives. Ensure each variation reaches the required number of visitors for valid results.
2. Statistical Significance in A/B Testing
The statistical significance level (or confidence, significance of the results, or chance of beating the original) shows how significant your result is statistically.
As a digital marketer, you’d want to be sure about the results so that the statistical significance indicates that the differences observed between a variation and control aren’t due to chance.
The industry standard ofstatistical significance should be 95%(or 90% in some cases). This is the target number you should consider when running an A/B test.
95% statistical significance means you are 95% confident that the results are accurate. It means that if you repeat the test repeatedly, the results will match the initial test in 95% of cases.
3. A/B Test Duration
Whencan you end an A/B test? It depends on several factors but shouldn’t end prematurely or drag on too long.
Our CRO manager,Hatice Kaya, suggests running a test for at least an entire business cycle or seven days.
This can vary depending on the product or service, as some sell more on paydays and less throughout the month.
Every website has a business cycle—the time it typically takes customers to purchase. Some sites have lower conversions on weekends and peaks on weekdays. Run your test throughout the cycle to account for fluctuations and get valid data.
Seven days is a minimum. The actual duration depends on your site traffic. Lower traffic requires more extended tests.
Use anonline A/B testing calculatorto determine the optimal duration. For example, with 5000 daily visitors and three variations, a test should run for 18 days.
4. Number Of Conversions
It’s a common belief that website conversions depend on traffic volume. High-traffic sites usually get more conversions, and vice versa.
However, when you run a test on high-traffic sites, you do not have to worry about the number of conversions; you should just focus on reaching the required sample size for that traffic.
But when it comes to low-traffic sites, to get more accurate results, you should keep in mind two factors:
- Sample size per variation
- The number of conversions.
Your test should reach the required sample size and have at least 2-300 conversions per variation (this is the pure minimum). It is even better if it reaches more than 300 conversions per variation.
So, now we have checked our test results and made sure that they are valid and don’t contain anystatistical errors. Let’s move on to a deeper analysis.
5. Analyze External and Internal Factors.
Several external and internal factors impact every website you see. These factors include:
- Seasonality or holiday period: Some eCommerce sites’ traffic and sales are not stable all year—they tend to peak on Black Friday and Cyber Mondays. This could influence your test results.
- Marketing promotions and campaigns: If you run a marketing campaign on the same site as an A/B test, your general test results are more likely to be affected.
These factors increase data variance, leading to less accurate results. If your test runs during a holiday, consider relaunching it later to verify the results.
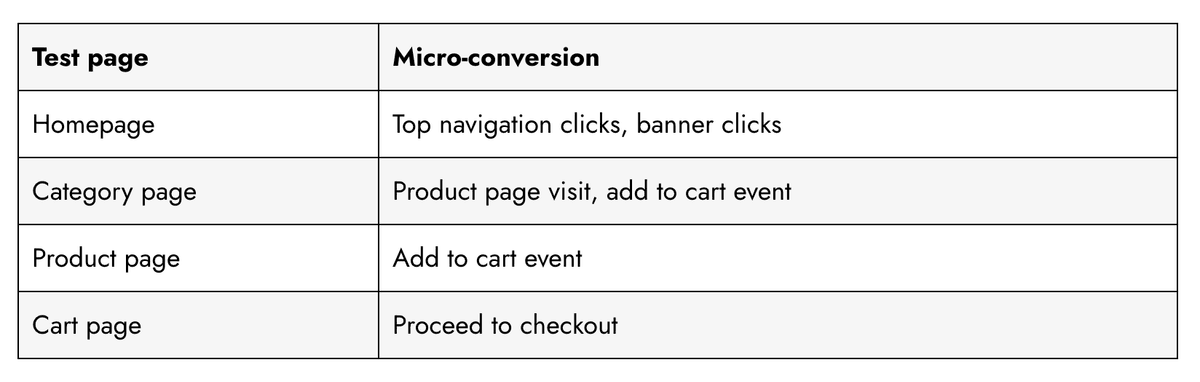
6. Analyze Micro-Conversion Data
While analyzing macro conversions (sales, leads, subscriptions) is essential, examining micro-conversions provides more profound insights.
Micro-conversions vary by business and website type, but examples for e-commerce sites include:
- Product page views
- Add to carts
- Clicks on product recommendations
- Newsletter signups
Here is an example of micro-conversion goals you may need to analyze for an ecommerce site.
Although micro-conversions don’t directly increase your conversion rate, they help move prospects down the funnel, leading to more purchases. Understanding micro-conversions can also explain why a test is performed a certain way.
What to do when your A/B test doesn’t win
Get a free conversion assessment.
Not all A/B tests will be winners, and conversion specialists must accept this reality. However, losing tests can be valuable learning opportunities.
Anwar Aly, a conversion specialist at Invesp, advises,
“If the loss rate is normal, businesses should learn from lost tests, recognizing that loss is part of A/B testing and can sometimes be more valuable than wins. If the loss rate is high or constant, re-evaluate your testing approach, possibly starting with a new audit and utilizing qualitative data to validate test hypotheses.”
In this section, I walk you through a checklist to evaluate losing tests and what you can do differently.
1. Review Your hypothesis:
A poorly thought-out hypothesis will result in poor AB tests and results. A characteristic of a poor hypothesis is the lack of insights driving the hypothesis.
This means that the company testing or the CRO agency often guesses what to test; it’s not a product of conversion research.
To create a better insight-driven hypothesis, you should use this format:
We noticed in [type of conversion research] that [problem name] on [page or element]. Improving this by [improvement detail] will likely result in [positive impact on key metrics].
So you can see what I mean; a real example of this would be:
We noticed in [the session recording videos] that [there was a high drop off] on [the product page]. Improving this by [increasing the prominence of the free shipping and returns] will likely result in [a decrease in exits and an increase in sales].
2. Were your variations different enough?
You’ll be surprised at how similar many variations are to the control.
What happened? Maybe a sentence was changed, or the color of the call to action button, but nothing major.
In this instance, getting a winning test is almost impossible because the variations don’t look different.
Check out this video to see the different categories of A/B tests we do to give you a different perspective:
3. Review click map and heatmaps for pages tested.
It’s normal to go through heatmaps and session recordings to see how site visitors and users engage with a page pre-test.
Post-test? Not so common.
This is a viable missing link in understanding why a test failed.
When you conduct post-test heatmap analysis and session recording of pages tested, you can see whether users engaged with or noticed the element you were testing.
Visitors click maps show heat maps of what visitors click on and how far they scroll down your pages. Even more important are visitor session recordings, which allow you to watch visitors’ exact mouse movements and journey through your website.
Top mistakes that make your A/B test results invalid
Many businesses focus on variation design in A/B testing, but the execution is equally important. Launching an experiment isn’t the end of the process; mistakes can invalidate your results.
- Too Many Variations: This slows down tests and can compromise data integrity. More variations require more traffic and longer test durations, increasing the risk of sample pollution due to cookie deletion.
- Changing Experiment Settings Mid-Test: Avoid altering experiment settings, goals, designs, or traffic allocations. Changing traffic split can cause Simpson’s Paradox, a statistical issue where trends in separate groups disappear when combined. It also skews results by affecting the sampling of returning visitors differently than new users.
Your Turn to Analyze A/B Test Results
Running an A/B test is not always about finding a variation that generates more conversions; sometimes, it’s about learning the changes in user behavior.
You should constantly be testing to understand your visitors, their behaviors, and the web elements that influence their behavior change.
Additional resources
1.Should you run the same test across all devices?
2. What to do when your A/B test keeps on losing.
3. What they don’t tell you about A/B testing velocity.
4. Top 6 A/B testing questions answered.
5. Why and how you should document experimentation insights.