
As interest grows in conversion optimization and A/B testing, marketers are always searching for a new design that will generate significant uplifts in conversion rates. Because the majority of AB tests fail to produce any meaningful results, many marketers are too eager to declare a winner for a split test.
So, even in the few instances where a testing software declares a winner, there is a good chance that you merely identified a false positive.
How do you avoid that?
You start by having a good handle on A/B testing statistics to ensure that your data is collected and analyzed correctly. Determining how long you should an AB experiment for is a critical component of conducting a successful conversion optimization program.
Some CROs think that there is no need for them to have a good grasp of statistics since they are only focused on conversion rates and leave the decision of determining a winner to the A/B testing software.
However, without having a good understanding of confidence and significance, can you determine a real winner? Even worse, did you find a winner or are you declaring a false positive?
I was speaking at a digital marketing conference recently where a presenter showed an AB testing case study with a 70% uplift in conversions rates.
It had the same problems that I have seen in many of AB testing case studies on the web. The experiment ran for too little time, and each variation (including the original) had less than 30 conversions.
The testing software showed the winner with a 99% significance. The presenter considered his results as proof that he found a real winner. Something enough to present enough a large audience in a conference.
I tried to correct to him, but he insisted that if the AB testing software declared a winner, then that should be enough. One comment that he said that stuck with me, “you should trust the laws of probabilities.”
I agree with him.
But he misapplied and misused the laws of probabilities!
So, how long should you run your AB test for? And why sometimes should you ignore your AB testing software when it tells you that it identified a winner.
Let’s start by understanding some of the fundamental statistics that impact our AB testing result calculations.
What is statistical significance in A/B testing?

What the average person understands by statistical significance and what statistician mean by it are two entirely different things.
In statistics “significant” means probably true. When a statistician calls the result of a test as “highly significant,” he means that it is very likely to be true. The statistician is not saying that the results are very important.
Significance level which you see in different split testing software shows you whether the contingency of a pattern in your data occurred by chance or not.
95% and the 99% statistical levels are the mostly used significance level in AB testing.
95% significance means that your finding has a 95% chance of being correct. This means of course 5% stands for the possibility that the result is false.
The AB test hypothesis
The AB test hypothesis consists of:
- Null hypothesis (Ho)
- Alternate hypothesis (H1)
The null hypothesis states the first position to be tested or the situation as it is (assumed to be) now, i.e., the status quo. Think of the null hypothesis as the test producing a null result. In a split test, it means that the original design generates the highest possible conversion rate.
The alternative hypothesis challenges the status quo (the null hypothesis), and it is a hypothesis that you believe to be true. The alternative hypothesis means that you think that one of the variations in your A/B test will generate a higher conversion rate compared to the original.
What is p-value?
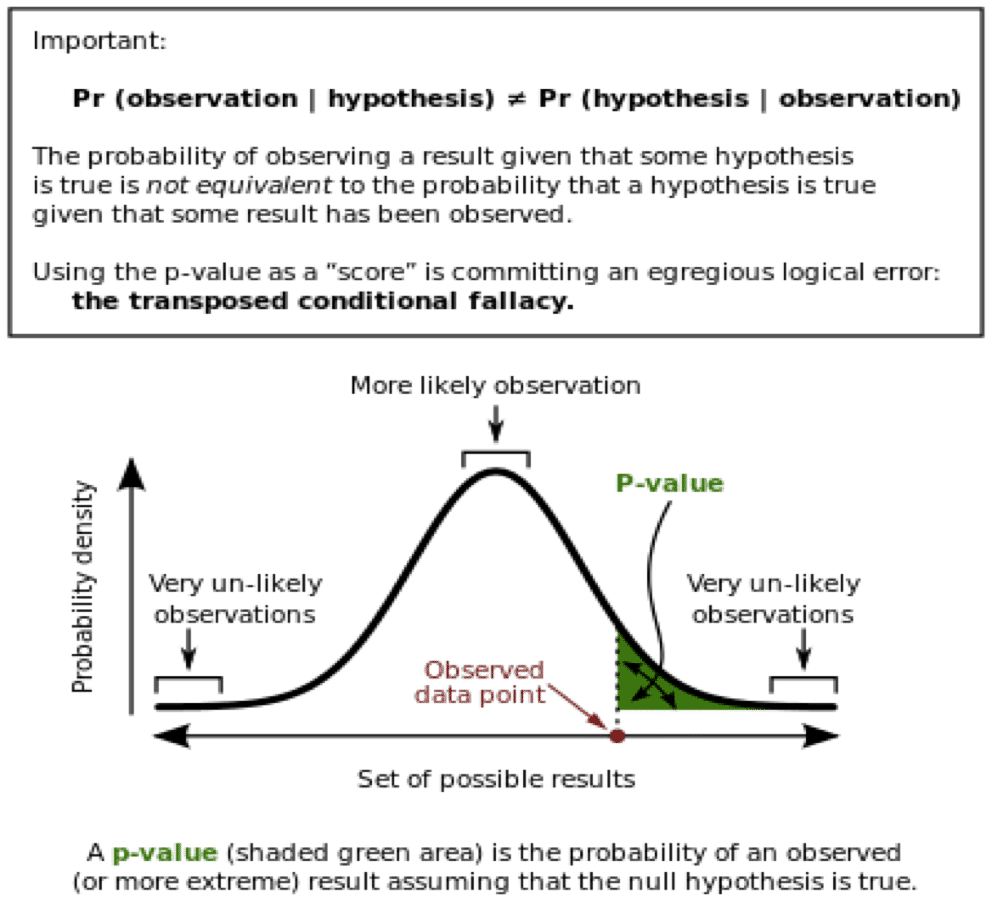
If the null hypothesis is correct, your A/B test does not find a winner and the current status quo (original design) produces the highest possible conversion rate.
P-value is a statistical measure to determine whether the null hypothesis is correct. Think of it as an index to measure the strength of the evidence against the null hypothesis.
Whenever you run a split test, there is a chance that your results are due to sampling errors. A p-value of .05 or less means that really should NOT dismiss the results for new design as due to sampling error. It says that you should take the results from the new design seriously.

In the social field, scientists use P < 0.05 (5% significance) as a standard level for concluding that there is evidence against the null hypothesis.
If your test produces results with a p-value of less than 0.05, then:
- There is a good chance that the status quo is NOT good, and
- you have discovered that the new design might work better for your users.
R.A. Fisher introduced the idea of statistical significance in 1930s, however, its understanding and interpretation have been misunderstood.
The authors of the book “the test of significance in psychological research,” discuss R. A Fisher framework around P-Values:
R.A. Fisher proposed if P is between 0.1 and 0.9 there is certainly no reason to suspect the hypothesis tested. If it’s below 0.02, it is strongly indicated that the hypothesis fails to account for the whole of the facts. We shall not often be astray if we draw a conventional line at 0.05.
P-value is a range value between 0 and 1. P-Values close to 0 tells that that the observed difference between original and variations is unlikely to be due to chance. That means alternate hypothesis is acceptable.
P-values close to 1 mean that there is no difference between the original and variations or that the difference is due to chance.
In the book, “Clinical trials and statistical verdicts”, Diamond GA, Forrester states:
It is an accepted fact among statisticians of the inadequacy of P-value as a sole standard judgment in the analysis of clinical trials
Relationship between p-value and sample size
Let us see a basic A/B test where you run one variation against an original. You let the test run until 100 visitors see the original and 100 visitors view the challenger.
The null hypothesis is that original will generate the highest conversion rate, and thus none of the variations will generate an increase in conversions. The alternate hypothesis is that one of the challengers will produce an increase in conversions.
Your initial results look like this:
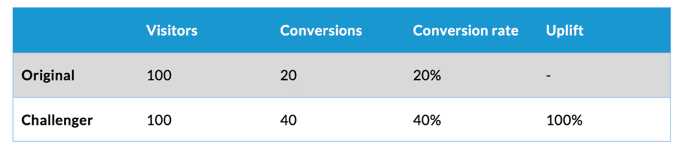
When you analyze the data, you find that the P-value for this test is 0.001 (0.1%).
Since you ran the test using an AB test software, the visitors who viewed either the original or the variation were selected randomly (at least you hope so). Based purely on the numbers above, it seems that you found a winner and that you should accept the alternate hypothesis.
But there is something problematic.
At first glance, it looks like we reached the right result. However, we could be wrong if the test sample a tiny percentage of the website visitors.
What factors impact the P-value in an A/B test?

Three factors impact the P-value:
1. Effect size: In standard A/B testing, we calculate the conversion rate for each variation. The effect size is calculated by dividing the number of conversions by the number of visitors. The effect size is the uplift from one variation compared to the original. In the example above, the effect size is 100%. The higher the effect size, the closer the P-value is to 0.
2. The spread of the data: The standard deviation is used to measures the spread of data. The larger the standard deviation, the lower the P-value is.
STD = SQRT(CR * (1-CR))
3. Sample size: This is the number of visitors who went through the test. In the example above, the sample size is 200. The larger the sample size, the more likely you can detect a difference. To calculate the number of unique visitors required for a split test, we use the following formula:
At 80% power:
N= 16 * total number of variations * (STD/CR* Effect size)^2
At 95% power
N= 26 * total number of variations * (STD/CR* Effect size)^2
You can learn more about all the math behind calculating the sample size from here but be prepared for an extended reading.
Example:
You run an A/B test with one challenger to the original. The original conversion rate is 5%. Your goal is to detect a minimum of 10% improvement. The experiment includes two variations.
Spread of the data (STD) = SQRT(5% * (1-5%))
Sample Size (N) = 16 * total number of variations * (STD/CR* Effect size)^2
N = 16 * 2 * (STD/5%*10%)^2
N = 60,800
Let’s take the same example but we will change the goal to detect a minimum of 30% improvement.
STD = SQRT(5%(1-5%))
N= 16 * total number of variations * (STD/CR* Effect size)^2
N = 16 * 2 * (STD/5%*30%)^2
N = 6,756
Notice that the higher the desired observed improvement, the smaller sample size we need to include in the test.
Using sample size to determine how long you should run an A/B test

We have seen how to calculate the required sample size for an AB experiment.
The biggest challenge in this calculation is having to pre-determine the minimum of improvement from running an AB test before launching it. The higher the expected improvement for an experiment, the smaller the sample size you will need.
How to Calculate Duration of A/B Test? Beyond sample size

From a purely statistical perspective, calculating the expected duration for a test is easy when you have determined the sample size:
Expected experiment duration = samples size/number of visitors to the tested page.
So, in our example, if the tested pages receive 2,000 visitors per day, then let’s plug in the numbers:
At a minimum of 30% improvement, the minimum samples size is 6,756.
Expected duration = 6,756/2,000 = 3.3 days
So, should we run the test for three days?
NO!
Why not, if our calculations are telling us that all we need is to run the test for three days?
It still has a lot to do with statistics. Fundamental to all of our calculations is the assumption that we are using a random sample of visitors to the page we are testing. Without that assumption, the laws of probability will NOT apply.
In A/B testing, I would argue that a representative sample is even more critical for the accuracy of calculations, for determining how long to run a test for and for determining a winner.
For you to get a representative sample and for your data to be accurate, experts recommend that you run your test for a minimum of one to two week.
By doing so, you would have covered all the different days which visitors interact with your website. We know from data that shopping behavior during the weekend is typically different from shopping behavior during weekdays.
We also recommend running the test for a maximum period of four weeks.
But what if your buying cycle is 6 or 8 weeks, wouldn’t be better to run the test to cover the typical buying cycle?
Some in the industry argued for that. And I can understand the rational to some extent. But you should remember that at any point, for any period, there will always be visitors at different stages in the buying funnel.
We do not run tests in a controlled environment. As you are conducting AB experiments, there is a chance for external and internal factors to pollute your testing data. We try to limit the possibility of data pollution by limiting the time we run a test to four weeks.
Confidence intervals & standard error

When conducting an AB test, we typically take a look at the conversion rate for each of the variations (as well as the original). However, we know that conversion rates fluctuate up and down. Confidence interval helps us calculate that range of values a variation conversion rate will be in at a specific confidence interval.
A 95% confidence level means that we 95% confidence in the method for generating the interval, which produces a range of plausible values. It is NOT a probability of a correct value being in that range.
The confidence interval is a range of values that is likely to contain the actual effect of the variant on the conversion rate of the control. A 95% confidence interval is an interval that has 95% probability of containing the actual conversion rate.
If you repeat your AB test multiple times, you will notice that the conversion rate for different variations will vary. We use “standard error” to calculate the range of possible conversion values for a particular variation. The standard error is used to calculate the deviation in conversion rates for a specific variation if we repeat the experiment multiple times.
For a given conversion rate (CR) and a number of trials (n), the standard error is calculated as:
Standard Error (SE) = Square root of (CR * (1-CR) / n)
At a 95% confidence, we can calculate the range of conversion rates for a particular variation as follows: CR% ± Z * SE
Where the value of Z is dependent on the confidence interval as follows:
| 90% | 1.645 |
| 95% | 1.96 |
| 99% | 2.575 |
At a 95% confidence interview, we can calculate the range of conversion rates for a particular variation as follows:
CR% ± 1.96 * SE
Let’s take the previous example:
Standard Error (SE) = Square root of (20% * (1-20%) / 1000) = 0.012649111
Range of values for original = 20% ± 1.96 * 0.012649111 = 22.47% to 17.52%
Range of values for V1 = 40% ± 1.96 * 0.012649111 = 42.47% to 37.52%
There is a lot of focus on statistical significance in A/B testing. However, achieving statistical significance should never be the only factor in deciding whether you should stop an experiment or not. You should look at the length of time your test ran for, confidence intervals and statistical power.


