
Conversion rate is a relative metric that varies significantly across different industries and even within the same industry.
While there is no one-size-fits-all benchmark for a “good” conversion rate, it is generally considered to be the rate that aligns with a website’s specific goals and objectives.
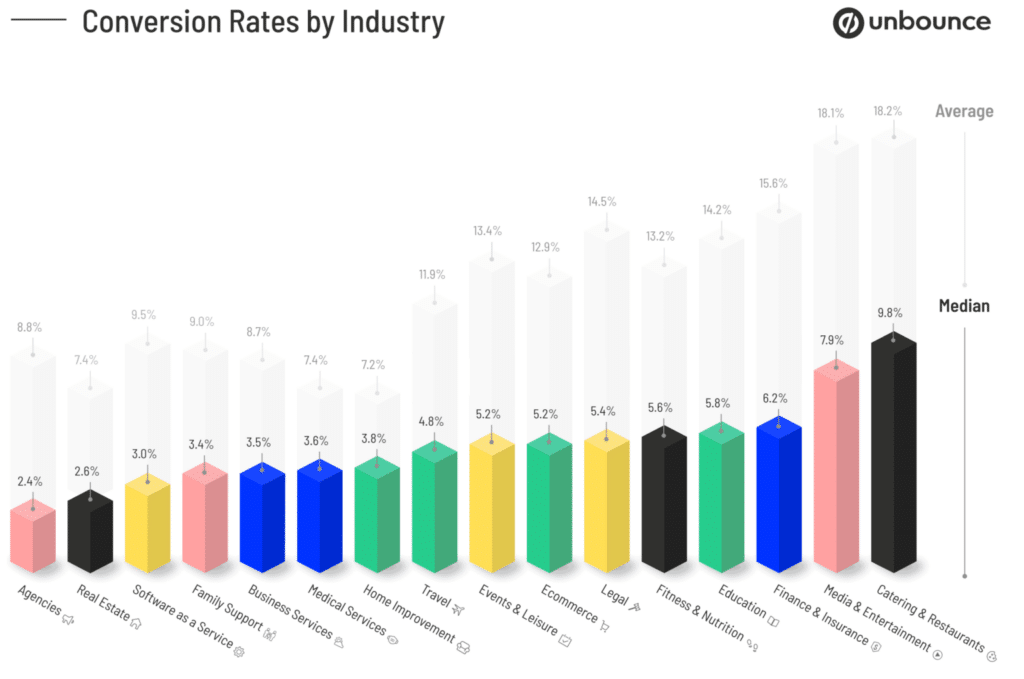
As seen in the image below, Unbounce analyzed over 44,000 landing pages across popular industries and found that each industry has a different average, with the catering and restaurant industries having the highest.
A critical factor influencing the variation in conversion rates is the industry in which a website operates.
Industries with distinct consumer behaviors and purchase cycles will naturally have different conversion rate averages. For example, e-commerce websites selling luxury goods may have lower conversion rates due to the higher price points and more extended consideration periods than online retailers offering inexpensive everyday items.
Furthermore, within the same industry, individual websites may experience different conversion rates due to a combination of factors:
- Traffic Sources: Websites that receive traffic from diverse sources, such as organic search, paid advertising, social media, or referral links, may have varying conversion rates. The quality and intent of visitors arriving from different sources can significantly impact their likelihood of conversion.
- Visitor Volume: A website’s traffic is crucial in determining the conversion rate. Smaller niche websites may have higher conversion rates as they attract more targeted and engaged visitors. In contrast, more extensive websites with higher traffic volumes might have lower conversion rates due to a more diverse audience.
- Brand Perception: Brand reputation and customer trust heavily influence conversion rates. Well-established brands with a strong reputation may see higher conversion rates as visitors are more confident purchasing or taking desired actions.
- User Experience (UX) Design: Websites prioritizing user-friendly and intuitive experiences tend to have better conversion rates. A well-designed website with easy navigation and clear calls-to-action (CTAs) encourages visitors to complete conversions.
To determine a reasonable conversion rate for a specific website, it is essential to establish clear objectives and benchmark against industry averages and past performance.
Regularly monitoring and analyzing conversion rates can help identify areas for improvement and guide optimization efforts.
How To Calculate Conversion Rate For Your Website
The conversion rate formula isn’t complicated at all:
Conversion Rate = Total number of conversions / Total number of sessions* x 100
Let’s break down this conversion rate formula further:
Total number of conversions: This refers to the total count of desired actions or outcomes that you are tracking in a particular scenario. Conversions are the specific goals you want your audience to achieve, such as making a purchase, signing up for a newsletter, filling out a contact form, or completing any other action that aligns with your business objectives.
Total number of sessions: This refers to the total number of interactions or visits that users have with a website or digital platform over a specific period. In web analytics, a session represents a single visit or interaction a user has with your website.
For example, if your site gets a total of 100,000 sessions and registers a total of 10,000 orders in one month, this is how you calculate the conversion rate for your website:
Conversion Rate = 10,000/100,000 = 10%
It’s important to note that some analytic tools use the number of clicks or website visitors instead of sessions.
How Do You Calculate the Sales Conversion Rate?
The sales conversion rate is a metric used to measure the effectiveness of a sales process by determining the percentage of potential customers who make a purchase. It’s a crucial metric for businesses to evaluate their sales efforts and identify areas for improvement.
To calculate the sales conversion rate, you’ll need two critical pieces of information: the number of successful conversions (sales) and the total number of potential customers (leads or prospects). Here’s the formula:
Sales Conversion Rate = (Number of Conversions / Total Number of Leads) × 100
Let’s break down the formula:
Number of Conversions: This refers to the number of potential customers who purchased or completed the desired action, such as signing up for a service, subscribing to a newsletter, or making a sale.
Total Number of Leads: The total number of potential customers who entered the sales funnel or were exposed to your marketing efforts. This can include website visitors, email recipients, or people who interacted with your advertising campaigns.
Sales Conversion Rate: This is the percentage of leads successfully converted into customers. To get the conversion rate as a percentage, you multiply the ratio of conversions to leads by 100.
Here’s an example:
Let’s say you have an online store, and you tracked the following metrics for a specific campaign:
Number of Conversions (sales): 150
Total Number of Leads (website visitors from the campaign): 1000
Sales Conversion Rate = (150 / 1000) × 100 = 15%
In this example, the sales conversion rate is 15%, which means that 15% of the leads from the campaign resulted in a purchase.
Remember that the sales conversion rate can vary depending on factors like the quality of leads, the effectiveness of your sales process, the appeal of your product or service, and the overall market conditions. Monitoring and comparing this metric to industry benchmarks can help you assess your sales performance and make informed decisions to optimize your strategies.
What Are Conversion Rates Examples?
Conversion rates can apply to various scenarios in business and marketing. Here are some examples of conversion rates in different contexts:
E-commerce Conversion Rate:
Online Sales Conversion Rate: The percentage of website visitors who purchase. For example, if 500 people visit an online store and 20 make purchases, the conversion rate would be (20 / 500) * 100 = 4%.
Lead Generation Conversion Rate:
Lead-to-Conversion Rate: The percentage of leads (potential customers) that ultimately convert into paying customers. If 100 leads were generated and 10 became customers, the conversion rate would be (10 / 100) * 100 = 10%.
Form Submission Conversion Rate:
When customers need to fill out a form (e.g., for a free trial or a quote request), this rate indicates the percentage of form submissions that result in a desired action. If 50 forms are submitted, and five lead to a purchase, the conversion rate would be (5 / 50) * 100 = 10%.
Email Marketing Conversion Rate:
Email Open Rate: The percentage of recipients who open an email. If an email is sent to 1000 people and 150 open it, the open rate would be (150 / 1000) * 100 = 15%.
Click-Through Rate (CTR): The percentage of recipients who click on a link in an email. If 1000 people receive an email and 50 click a link inside it, the CTR would be (50 / 1000) * 100 = 5%.
Website Traffic:
Website Conversion Rate: The percentage of visitors who complete a desired action on your website, such as signing up for a newsletter or filling out a contact form. If 1000 people visit a website and 30 sign up for the newsletter, the conversion rate would be (30 / 1000) * 100 = 3%.
Advertising Conversion Rate:
Click-Through Rate (CTR) for Ads: The percentage of people who click on an ad after seeing it. If an ad is shown 500 times and 25 people click, the CTR would be (25 / 500) * 100 = 5%.
Conversion Rate for Ad Campaign: The percentage of users who take a desired action after clicking on an ad, such as purchasing or signing up. If 200 people click on an ad and 10 make a purchase, the conversion rate would be (10 / 200) * 100 = 5%.
Social Media Conversion Rate:
Engagement Rate: The percentage of people who engage with a social media post, including likes, comments, and shares. If a post receives 200 likes and 20 comments and 1000 people saw it, the engagement rate would be ((200 + 20) / 1000) * 100 = 22%.
These are just a few examples of how conversion rates are used to measure the effectiveness of various marketing and business activities. The specific metrics and calculations can vary depending on the context and the goals of the campaign or strategy.
Video Source – 7 Ways to boost conversions for e-Commerce Websites
Why Is It Important To Calculate Website Conversion Rate?
Calculating conversion rates is a crucial aspect of analyzing and optimizing a website’s performance, particularly for businesses operating in the digital realm. Here’s a detailed explanation of why calculating conversion rates is so important:
Performance Measurement
Conversion rates provide a clear indication of how well a website is performing. By tracking the percentage of visitors who take a desired action, businesses can assess whether their online presence meets its intended purpose. This information is invaluable for evaluating the return on investment (ROI) for various marketing efforts, such as advertising campaigns, SEO strategies, and content marketing.
Effectiveness of User Experience
A website’s design, navigation, content, and overall user experience significantly influence conversion rates. Low conversion rates may indicate that visitors encounter barriers or frustrations that prevent them from completing desired actions. By monitoring conversion rates, businesses can identify pain points in the user journey and implement improvements to enhance user experience.
Optimization Opportunities
Conversion rate tracking allows businesses to identify which elements of their website are working well and which are underperforming. Through A/B testing, businesses can experiment with different variations of web pages to see which changes lead to higher conversion rates. This iterative optimization process continuously improves the website’s performance and effectiveness.
Effective Resource Allocation
Conversion rate data helps businesses allocate their resources more effectively. By focusing on elements of the website that contribute most to conversion rates, such as call-to-action buttons, landing page design, and checkout processes, businesses can prioritize improvements that yield the greatest impact on their bottom line.
Insights into Audience Behavior
Conversion rates provide insights into how visitors interact with the website. By analyzing the flow of user behavior leading up to conversions, businesses can better understand their audience’s preferences, interests, and decision-making processes. This knowledge informs content creation, product development, and marketing strategies tailored to the target audience.
Benchmarking and Goal Setting
Conversion rates serve as benchmarks to measure the progress of a website over time. Setting achievable conversion rate goals based on industry standards or historical data allows businesses to track their performance against these goals. This practice encourages a culture of continuous improvement and helps businesses stay competitive in their respective markets.
Identifying Marketing Effectiveness
Businesses often invest in various marketing channels, such as social media, paid advertising, email campaigns, etc. By correlating conversion rates with incoming traffic sources, businesses can determine which marketing channels are generating the most valuable visitors and conversions. This information informs decisions about where to allocate marketing budgets and efforts for the best results.
Data-Driven Decision Making
Conversion rate analysis provides businesses with concrete, data-driven insights rather than relying on assumptions or intuition. This allows for more informed decision-making based on actual user behavior and outcomes.
Conversion Rate Optimization
The beauty of CRO is to win back the money spent to attract those 1,500 potential customers, getting a higher return for each dollar invested. With the same investment for attracting visitors but knowing how to address these visitors’ behavior better, a CRO program can bring outstanding results in profit, CAC, and ROI.
When starting with CRO, companies aim at these results but sometimes fail to acknowledge CRO is not a light switch you turn on. Conversion optimization is a long-term commitment. The results are cumulative and come from continuous improvement.
In the video below, you can see the real-life progression of conversion rate optimization for two of our clients. The tables and trend lines we show in the video will help set real expectations of a consistent but non-linear conversion uplift. As you see, there are picks in the results over the months and development of these results within 6, 12, and 16 months.
Video Source – Conversion Rate Impact on Your Campaign Profitability By Invesp
FAQs Around Conversion Rate Calculation
How to measure conversion rate
Conversion rate is measured by dividing the number of completed desired actions, such as purchases or form submissions, by the total number of visitors to a website or participants in a marketing campaign and then multiplying the result by 100 to express it as a percentage.
What is the conversion rate formula?
The conversion rate formula is Conversion Rate = (Number of Conversions / Total number of visitors) * 100. For example, if a website had 200 conversions from 5,000 visitors, the conversion rate would be (200 / 5,000) * 100 = 4%, indicating that 4% of the total visitors took the desired action. Calculating conversion rate is essential in evaluating the effectiveness of online activities or marketing efforts.
What is the formula for lead conversion rate?
The formula for lead conversion rate is similar to the general conversion rate formula but focuses explicitly on leads. It is calculated by dividing the number of converted leads by the total number of leads generated and multiplying the result by 100 to express it as a percentage.
What is a good conversion rate?
A “good” conversion rate can vary widely depending on factors such as industry, type of conversion, and the specific goals of a website or campaign. Generally, conversion rates are considered relative, and what might be considered a reasonable rate for one business or campaign might not be the same for another. However, as a broad guideline, a 2% to 5% conversion rate is often considered average, and rates above 5% are often seen as above average or good.
How do you track conversions?
Conversion tracking should start by defining the specific conversion goals, such as form submissions or completed purchases. Analytics tools like Google Analytics can help you embed the conversion tracking code on your website. This code enables the collection of data on user interactions, and it helps with tracking conversions. You can set up goal or conversion tracking events in Google Analytics to monitor the completion of specific actions.
How does a conversion rate calculator work?
A conversion rate calculator operates by taking the number of desired actions (conversions) and dividing it by the total number of visitors or interactions on a website or within a marketing campaign. This process provides a percentage representing the efficiency of converting visitors into customers or achieving other predefined goals.
Additional Resources
- Three PPC Conversion Optimization Tips To Increase PPC Conversion Rate
- How to Optimize Your PPC Campaigns
- Customer Acquisition Vs. Retention Costs – Statistics And Trends
- Maths and Stats behind Web Analytics – Beginners Guide
- How to calculate email conversion rate
Calculating Conversion Rate FAQs
How to calculate sales conversion rate?
Sales conversion rate measures how many leads actually turn into paying customers. To calculate it, divide the total number of sales by the total number of leads and multiply by 100: (Total Sales / Total Leads) × 100. A higher percentage means your sales process is working well, while a lower rate might indicate issues with lead quality, sales tactics, or follow-ups.
What does a 2% conversion rate mean?
A 2% conversion rate means that out of every 100 visitors, only two completed the desired action, whether that’s making a purchase, signing up for a newsletter, or filling out a contact form. While 2% might sound low, what qualifies as a “good” conversion rate depends on the industry, traffic quality, and type of action you’re measuring.
How to calculate email conversion rate?
Email conversion rate measures how many recipients took action after opening your email. The formula is: (Conversions from Email / Total Emails Delivered) × 100. For example, if you sent 1,000 emails and 50 people made a purchase, your email conversion rate would be 5%. A low rate might indicate weak messaging, poor targeting, or ineffective CTAs, while a high rate suggests your email campaign is driving meaningful results.
How to calculate MQL to SQL conversion rate?
The MQL to SQL conversion rate shows how well your marketing efforts are handing off qualified leads to sales. You calculate it by dividing the number of sales-qualified leads (SQLs) by the number of marketing-qualified leads (MQLs) and multiplying by 100: (SQLs / MQLs) × 100. If this rate is low, it could mean your marketing team is attracting the wrong audience, or sales isn’t effectively engaging with the leads. A high rate means strong alignment between marketing and sales.


