One of the questions you should deal with in conversion rate optimization is the impact a particular page (the homepage for example) or class of pages (product or category pages) on the overall website conversion rate. The answer to that question determines the impact of optimizing that page on your bottom line.
Let’s say that your analysis shows that the homepage of your site has several conversion issues and that it is ripe for optimization. You introduce a new design that fixes the conversion issues. You then test that design against the original homepage design. The AB test shows an uplift of 20%.
What is the impact of that 20% uplift in the homepage conversion rate on the site overall conversion rate?
To start with, there is no one-to-one correlation between the conversion rate of some of the pages to the overall website conversion rate. So, a 20% increase in the homepage conversion rate does not mean that you will increase the site conversion rate by 20%. By running a test on the homepage, you are only optimizing the experience of visitors who view the homepage. The improvements you introduced will not impact visitors who do not see/visit the homepage.
So, how do we identify the contribution a page has on the site conversion rate.
I first encountered this question back in 2010, trying to figure out which pages we should optimize on a project.
My first thought was to look at the percentage of pageviews a particular page generates compared to the total pageviews for the site.
Finding this number is not too hard in Google analytics. Navigate to Behavior > Site content > All pages:

In this case, you can see that the homepage had a total of 16,429 pages views from a total of 78,623 pages views for the site. That means the homepage is responsible for almost 20% of the site page views. Optimize the homepage page means optimizing 20% of the site page views.
Using pages views to determine the value of a page in the conversion funnel is problematic.
What if 5% of the visitors are in love with the homepage and keep on coming back to it. In that case, we are only optimizing the experience for 5% of the users. So, how many visitors are responsible for generating these page views?
Using visitors to determine the value of a web page: a better approach
Pulling the number of visitors who view a page is a little harder. I am not sure why Google analytics does not provide it out of the box.
The content reports in google analytics show how many pageviews and unique pageviews a page generated in a specific period. The reports do not show many visitors looked at that page. Some marketers confuse unique page views with users. They are not the same concept. Let’s take a look at Google analytics support:
A pageview is defined as a view of a page on your site that is being tracked by the Analytics tracking code. If a user clicks reload after reaching the page, this is counted as an additional pageview. If a user navigates to a different page and then returns to the original page, a second pageview is recorded as well.
A unique pageview, as seen in the Content Overview report, aggregates pageviews that are generated by the same user during the same session. A unique pageview represents the number of sessions during which that page was viewed one or more times.
So, unique pageviews for a particular page reflect how many sessions included a visit to that page.
Do not confuse sessions and unique pageviews

Some might look at the numbers above and think that the homepage had 11,905 sessions. That is a correct assumption. They continue to think that the site had 57,035 unique pages which means that it had 57,035 sessions. That is NOT a correct assumption.
Unique pageviews for a particular page reflect the number of sessions that viewed that page. However, adding all the unique pageviews for the different pages on the site does not give us the total sessions for the site. Think of a single user that comes to the site in a single session and visits the following pages:
/Homepage
/Cart
/Homepage
Analytics will show:
Users: 1 user
Sessions: 1 session
Site page views: 3
Site unique page views: 2
/Homepage pageviews: 2
/Homepage unique pageviews: 1
/Cart views: 1
/Cart unique pageviews: 1
So, if we know that 11,905 sessions had a visit to the homepage, what is the total sessions to the site?
You can also pull the number of visitors and sessions from analytics: Audience > Overview

So, 11,905 sessions visited the homepage of the total 16,576. So, 71.8% (11,905/16,576) of the sessions viewed the homepage.
Relying on the page views showed the homepage is valuable. Using sessions, showed us that the value of the homepage is even better than what we initially thought.
Since most of our CRO uses users and not sessions, I wondered how I can find the number of visitors who viewed a page.
Creating a custom Google Analytics report to determine the number of users who viewed a page
The best way to handle this is by following the instructions:
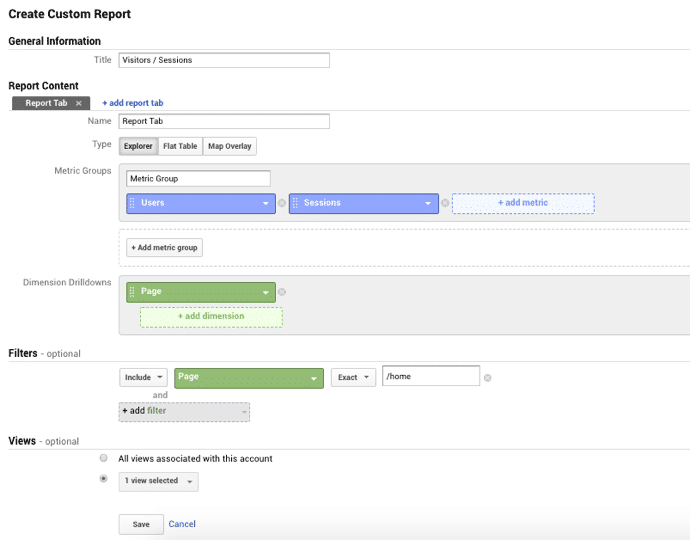
- To create a custom report, click on the “Customization” item in the left navigation menu, and then click on “Custom Reports”.
- The “Create Custom Report” page will open.
- Enter a name for your report.
- In the “Metric Groups” section, enter “Users”, “Sessions” and “Entrances.”
- If you would like to pull the data for one page, use the filter function on the custom report.
Here is the output of that report (I pulled the data for all the pages of the site):

According to this report, of the total 13,216 site users, 8,619 users visited the homepage (8,619/13,216=65%).
Custom report metrics: Confusing sessions with unique pageviews
According to this report, the sessions that included a visit to the homepage are 9,068. This is a much different number compared to the 11,905 sessions we got from the unique page views report.
So, which is correct?
When generating this customer report, the sessions reported on the page view dimension is limited to sessions where the page was a landing page. Sessions, where the particular page was not a landing page, are not included in the custom report. That is the reason, you can notice that the sessions number reported in the custom report matches the entrance in the same report.
So, the homepage, in this case, had the following metrics:
Page views: 16,429
Unique page views: 11,905
Total Sessions: 11,905
Sessions where the homepage was the landing page: 9,068
Users: 8,619
Let’s make things a bit more interesting.
How many of the visitors who converted viewed the homepage?
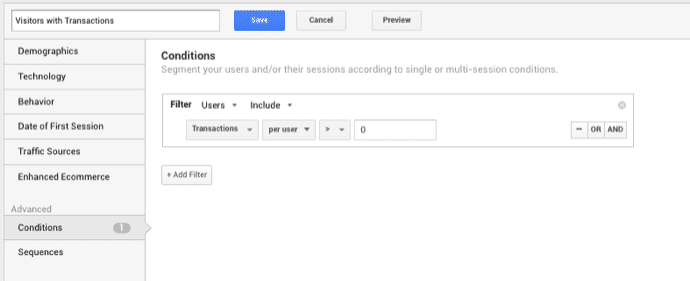
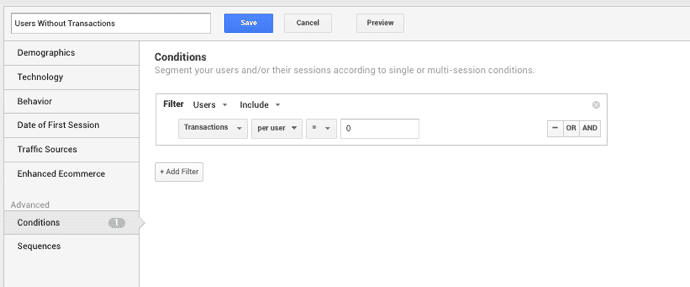
To answer that question, I use two custom segments:
Users with Transactions:
Users Without Transactions:
By applying these two segments to the custom report, we get the following:
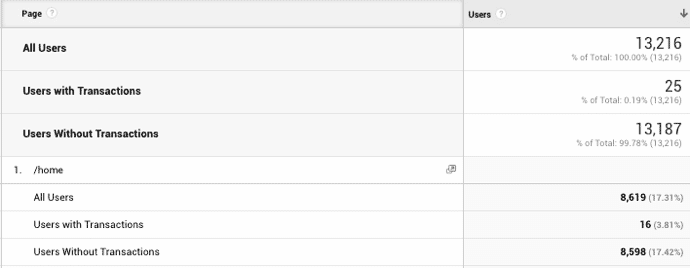
The site generated a total of 25 conversions, of these 16 conversions included a visit to the homepage (16/25 = 64%).
Whether I use sessions, users, or users with transactions, the homepage drives a lot of value to the site.
I usually advise our teams to look at three metrics to determine the value of a particular page.

