
In February this year, 31 500 apps were released on Apple’s app store. In May, approximately 90,000 apps were released on Google’s play store.
All this points to the fact that the mobile app landscape is evolving very fast.
To succeed in this competitive landscape, you need to understand user behavior and make data-driven decisions to optimize their in-app experiences with your product.
This is where app analytics tools play a crucial role.
App analytics tools are instrumental in helping you gain valuable insights into user behavior, engagement, and preferences.
They provide you with the necessary data to understand how users interact with your apps, identify areas for improvement, and drive app performance.
In this article, I’ll highlight the ten best mobile app analytics tools available in 2023.
These tools have been carefully selected based on their features, user satisfaction, reviews, and industry recognition.
Let’s get started.
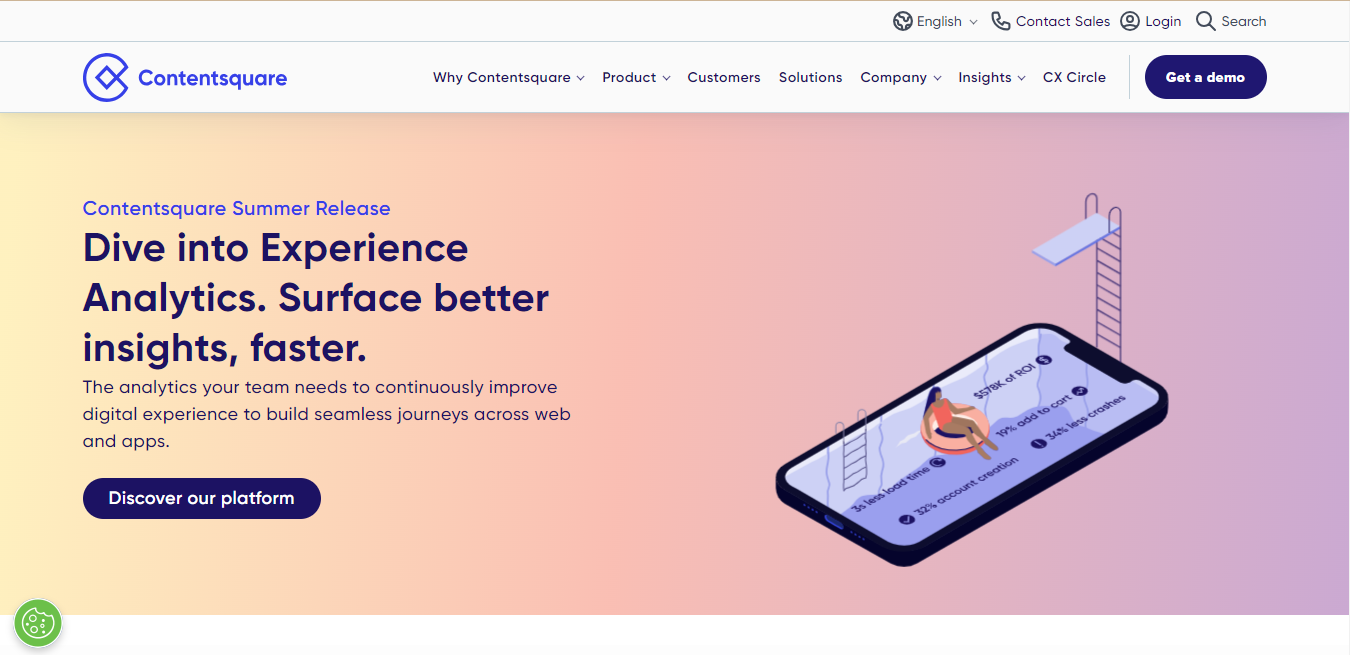
1. Contentsquare
G2 Score: 4.7/5
Platform: Android/Web/iOS
Price: contact sales
Trusted by brands like Zoom, Samsung, Verizon, NatWest, and Sephora, Contentsquare is a powerful analytics tool designed to provide deep insights into user behavior and optimize digital experiences.
It offers a range of features for data-driven decision-making. Contentsquare’s session replay feature allows businesses to visually replay user sessions, gaining valuable insights into user interactions, clicks, and scrolling behaviors.
Its zone-based heatmaps feature provides visual representations of user engagement, identifying areas of interest and potential friction.
With Contentsquare’s conversion funnel analysis, you can understand user journeys, identify drop-off points, and optimize conversion rates.
Its form analytics feature helps optimize form completion by analyzing user interactions and identifying areas for improvement.
Additionally, Contentsquare offers advanced segmentation capabilities, enabling you to analyze specific user groups based on demographics, behaviors, and preferences for personalized targeting and optimization.
Features
- Customer journey analysis – Visualize how customers progress through your site, page by page, from entry to exit. Understand behaviors, feelings, and intent each step of the way and turn those insights into action.
- Zone-based heatmaps – Visualize how visitors interact with each element on a web or mobile page. Combine unique metrics to tell a story about how your content, navigation, and merchandising help or hinder your customers from achieving their site goals.
- Session replay – Reconstruct an individual visitor session on your website or mobile app. Use this in combination with macro-level insights to quickly understand why a certain observed metric is happening or to confirm a specific hypothesis.
- Form analysis – Understand how users interact with your web forms by automatically capturing every click, scroll and hover on your form fields. Detect frustrations by analyzing where your users struggle or drop off to boost form conversions easily.
- Impact quantification – Prioritize which issues to focus on by quantifying the business impact, from conversion rates to revenue impact, of customer struggle, site performance, and experience on any page — all without the need for constant tagging
Pros of Contentsquare
- User-friendly interface and easy to navigate around
- Information easily accessible from the dashboard
Cons of Content Square
- The journey analysis graph is confusing.
- It takes time to load for some users.
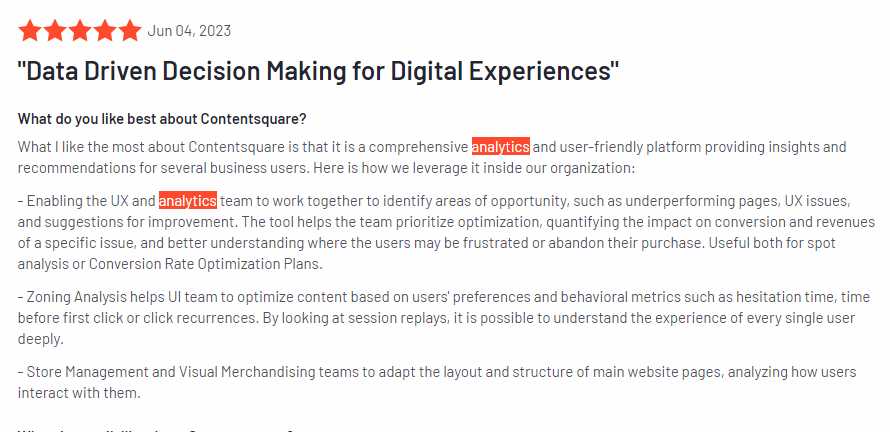
Review
2. Mixpanel
G2 Score: 4.6/5
Platform: Android/Web/iOS
Price: Free, Growth (starting at $25.00), Enterprise (contact Mixpanel)
This powerful analytics tool helps you track and analyze user behavior in your digital products.
With Mixpanel, you can create custom event tracking to monitor specific user actions, such as clicks or purchases, and segment your audience based on various criteria.
Its powerful funnel analysis allows you to visualize and optimize user journeys, while cohort analysis helps identify patterns and trends among different user groups.
Mixpanel also offers A/B testing capabilities, enabling you to experiment with different variations and measure their impact on user engagement and conversions.
Features
- Visualization: Mixpanel offers visualization tools to present data in a visually appealing manner, making it easier for users to understand and interpret analytics insights.
- Campaign Management: With this feature, users can track and analyze the effectiveness of marketing campaigns, enabling them to measure key metrics, optimize targeting, and make data-driven decisions.
- Model Training: Mixpanel provides machine learning capabilities that allow users to create custom models using their data, enabling advanced user analysis and predictions.
- Multivariate Testing: This feature enables users to test different variations of their mobile app, such as UI elements or features, and measure the impact on user behavior, allowing for data-driven optimizations and improvements.
Pros of Mixpanel
- Reports are intuitive.
- Lookup functionality allows you to add data without requesting help from the engineering team.
- You can define custom events based on your app’s unique features.
Cons of Mixpanel
- Exporting raw data from Mixpanel could be restrictive
- Complex to setup and configure
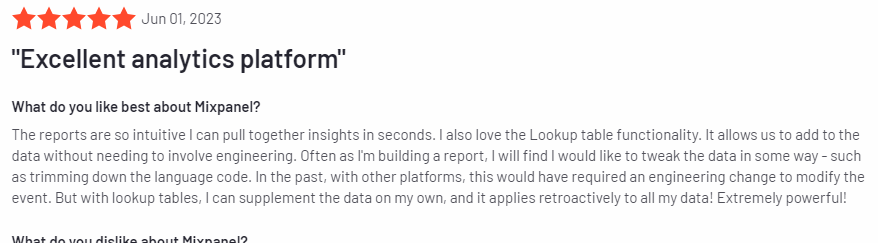
Review
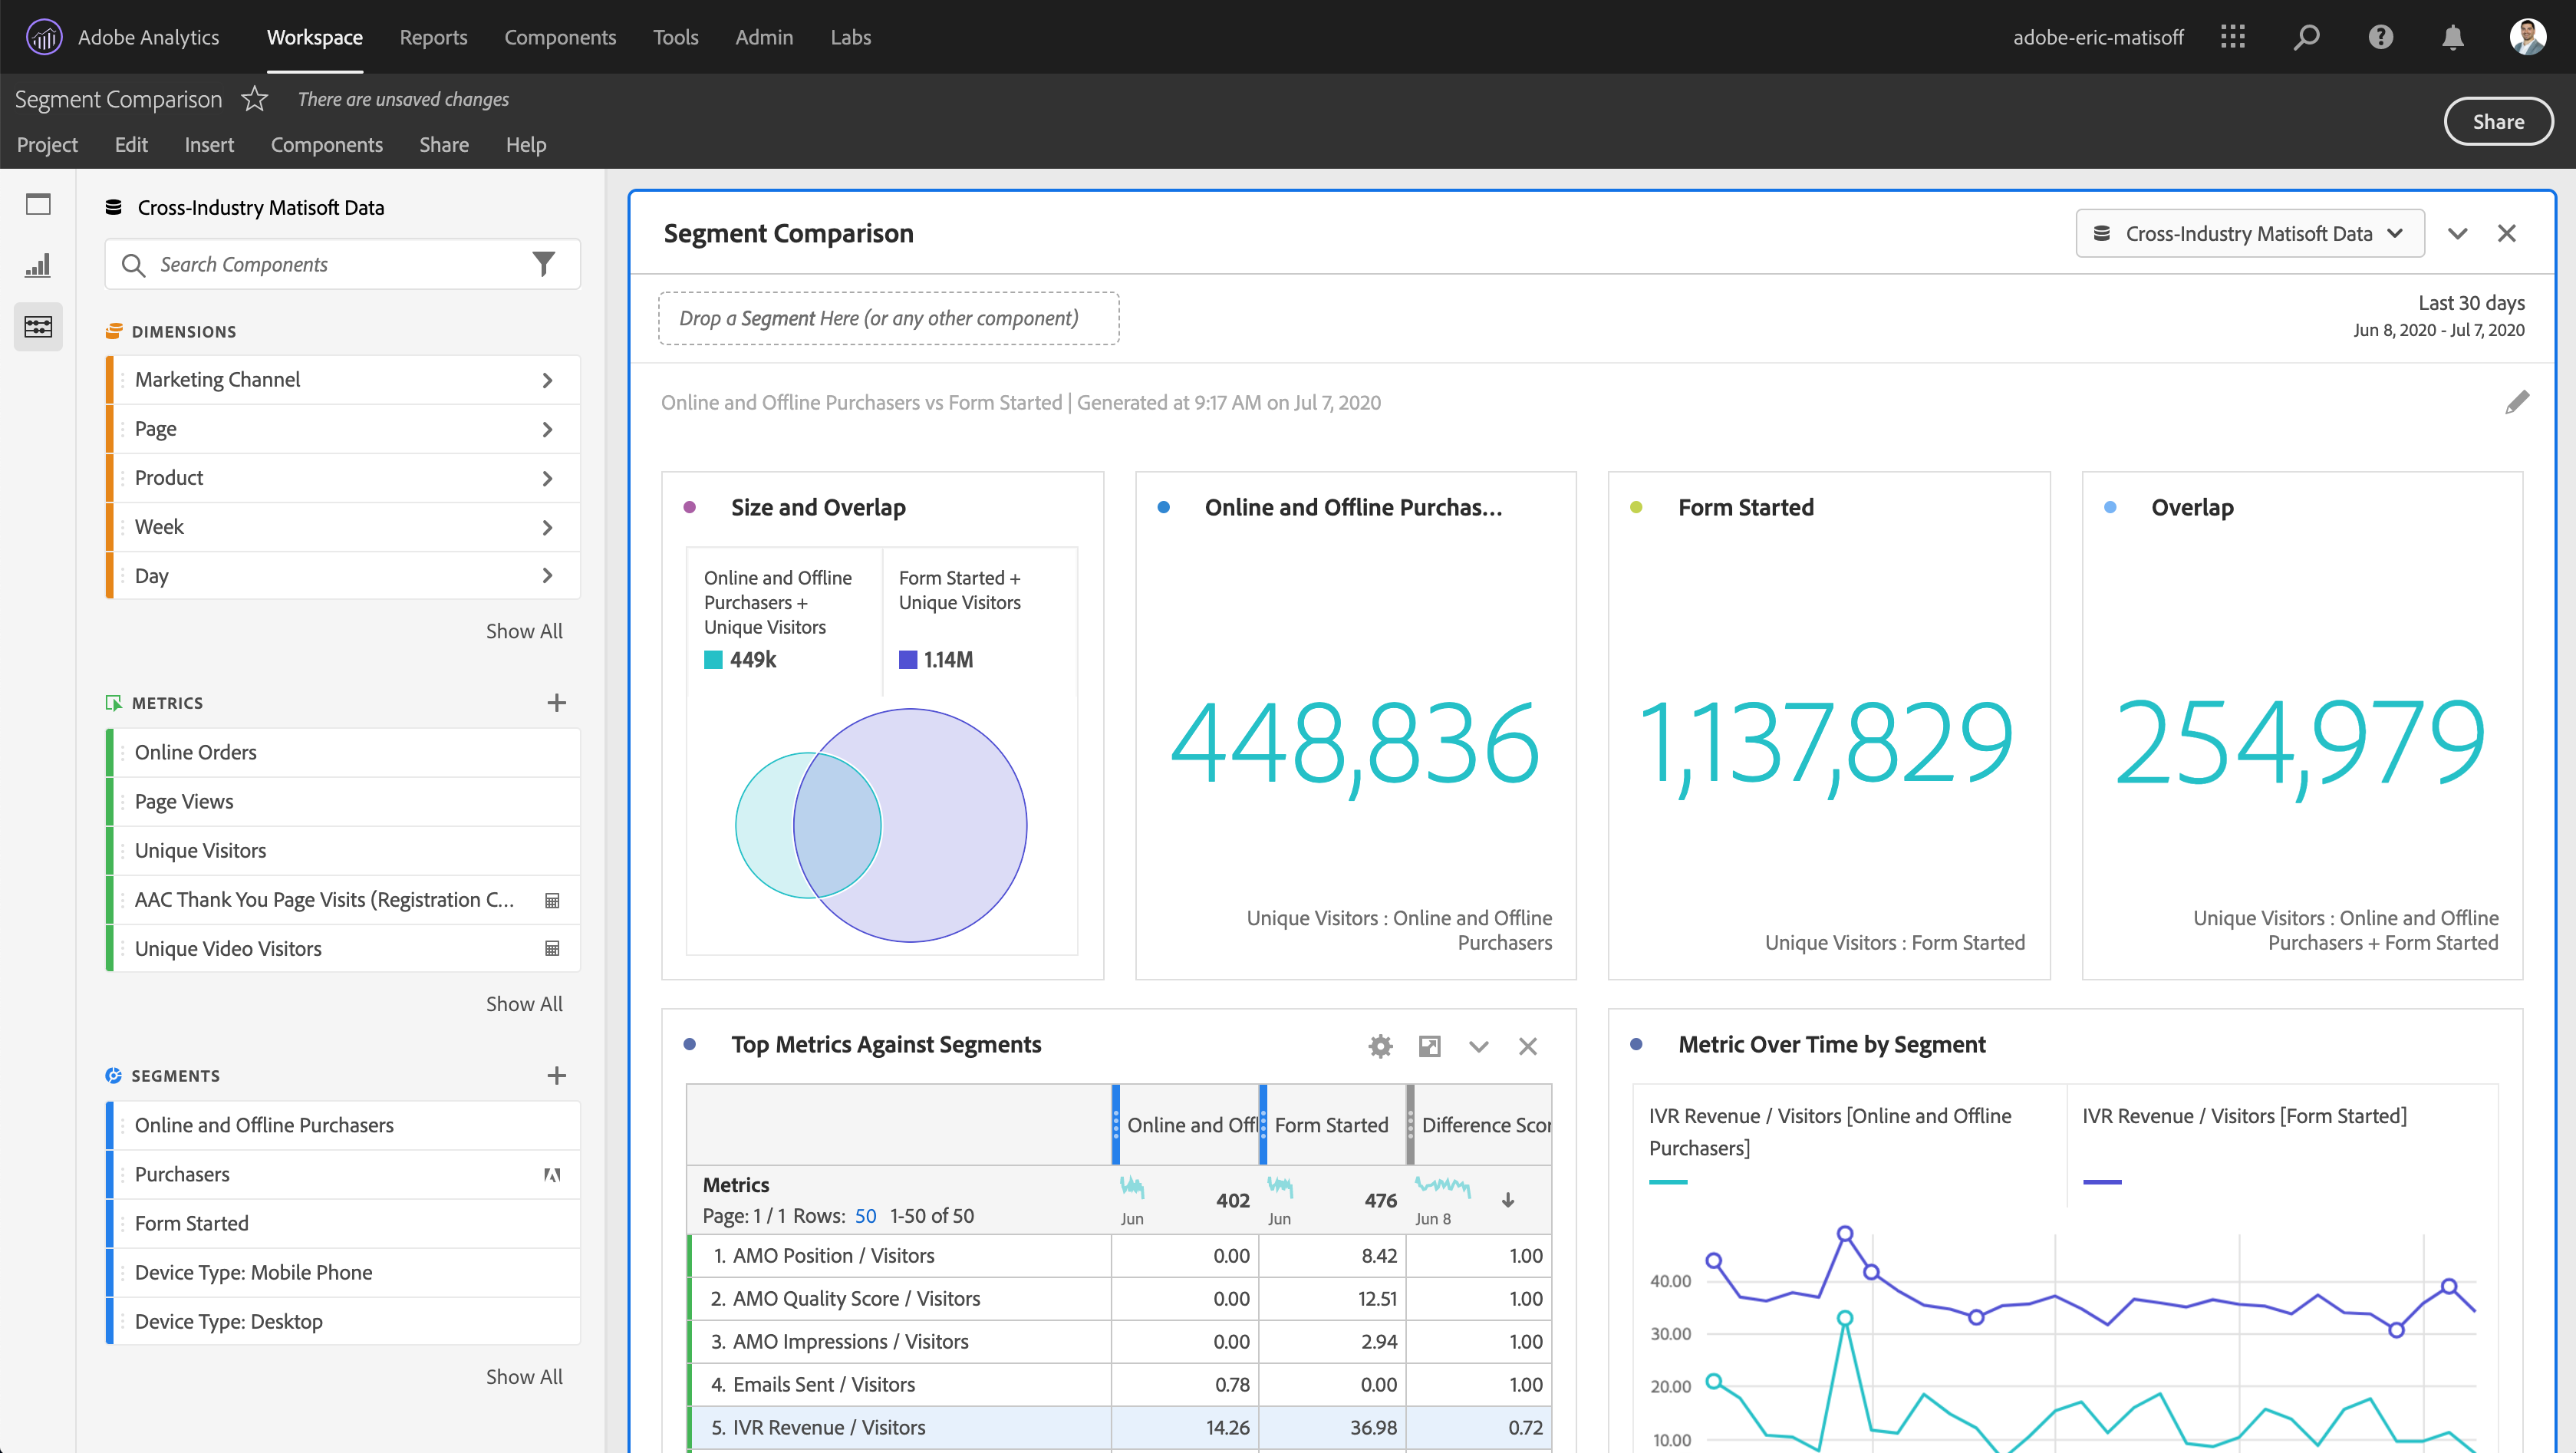
3. Adobe Analytics
G2 Score: 4.1/5
Platform: Android/iOS
Price: Paid
This robust analytics solution empowers you to understand and analyze user data across various channels and touchpoints.
It offers several key features to derive valuable insights and drive data-informed decisions.
With Adobe Analytics, you can track and measure customer interactions, enabling deep segmentation to uncover meaningful audience characteristics.
Its real-time reporting capabilities provide instant visibility into a website or app performance, helping you identify trends and make timely optimizations.
The tool also offers advanced attribution modeling, allowing you to understand different marketing channels’ impact on conversions.
Adobe Analytics also provides powerful data visualization and reporting tools for intuitive data exploration and sharing actionable insights.
Features
- Multichannel data collection – they offer multiple ways to collect data from any source. You can capture the web and mobile app data that matters most for data-driven decision-making and that maps to your business goals.
- Advanced calculated metrics – enable you to combine metrics to create mathematical and statistical operations that are used as new metrics. These metrics can be segmented and created for any report to which you add metrics.
- Marketing attribution – Multiple rules-based and algorithmic approaches to attribution offer robust analysis of customer behavior, providing a best-fit model per channel based on your customers’ actual interaction patterns.
- Shared audiences – You can create and manage audience segments based on any behavior and share that audience segment seamlessly to the Adobe Experience Cloud for activation in other Experience Cloud products.
Pros of Adobe Analytics
- Multitouch capabilities that track the user journey across several channels.
- Ease of navigation.
Cons of Mixpanel
- There’s a steep learning curve for Adobe Analytics.
- The data dictionary isn’t built into the tool, so the meaning of some tracking is lost on some users
Review

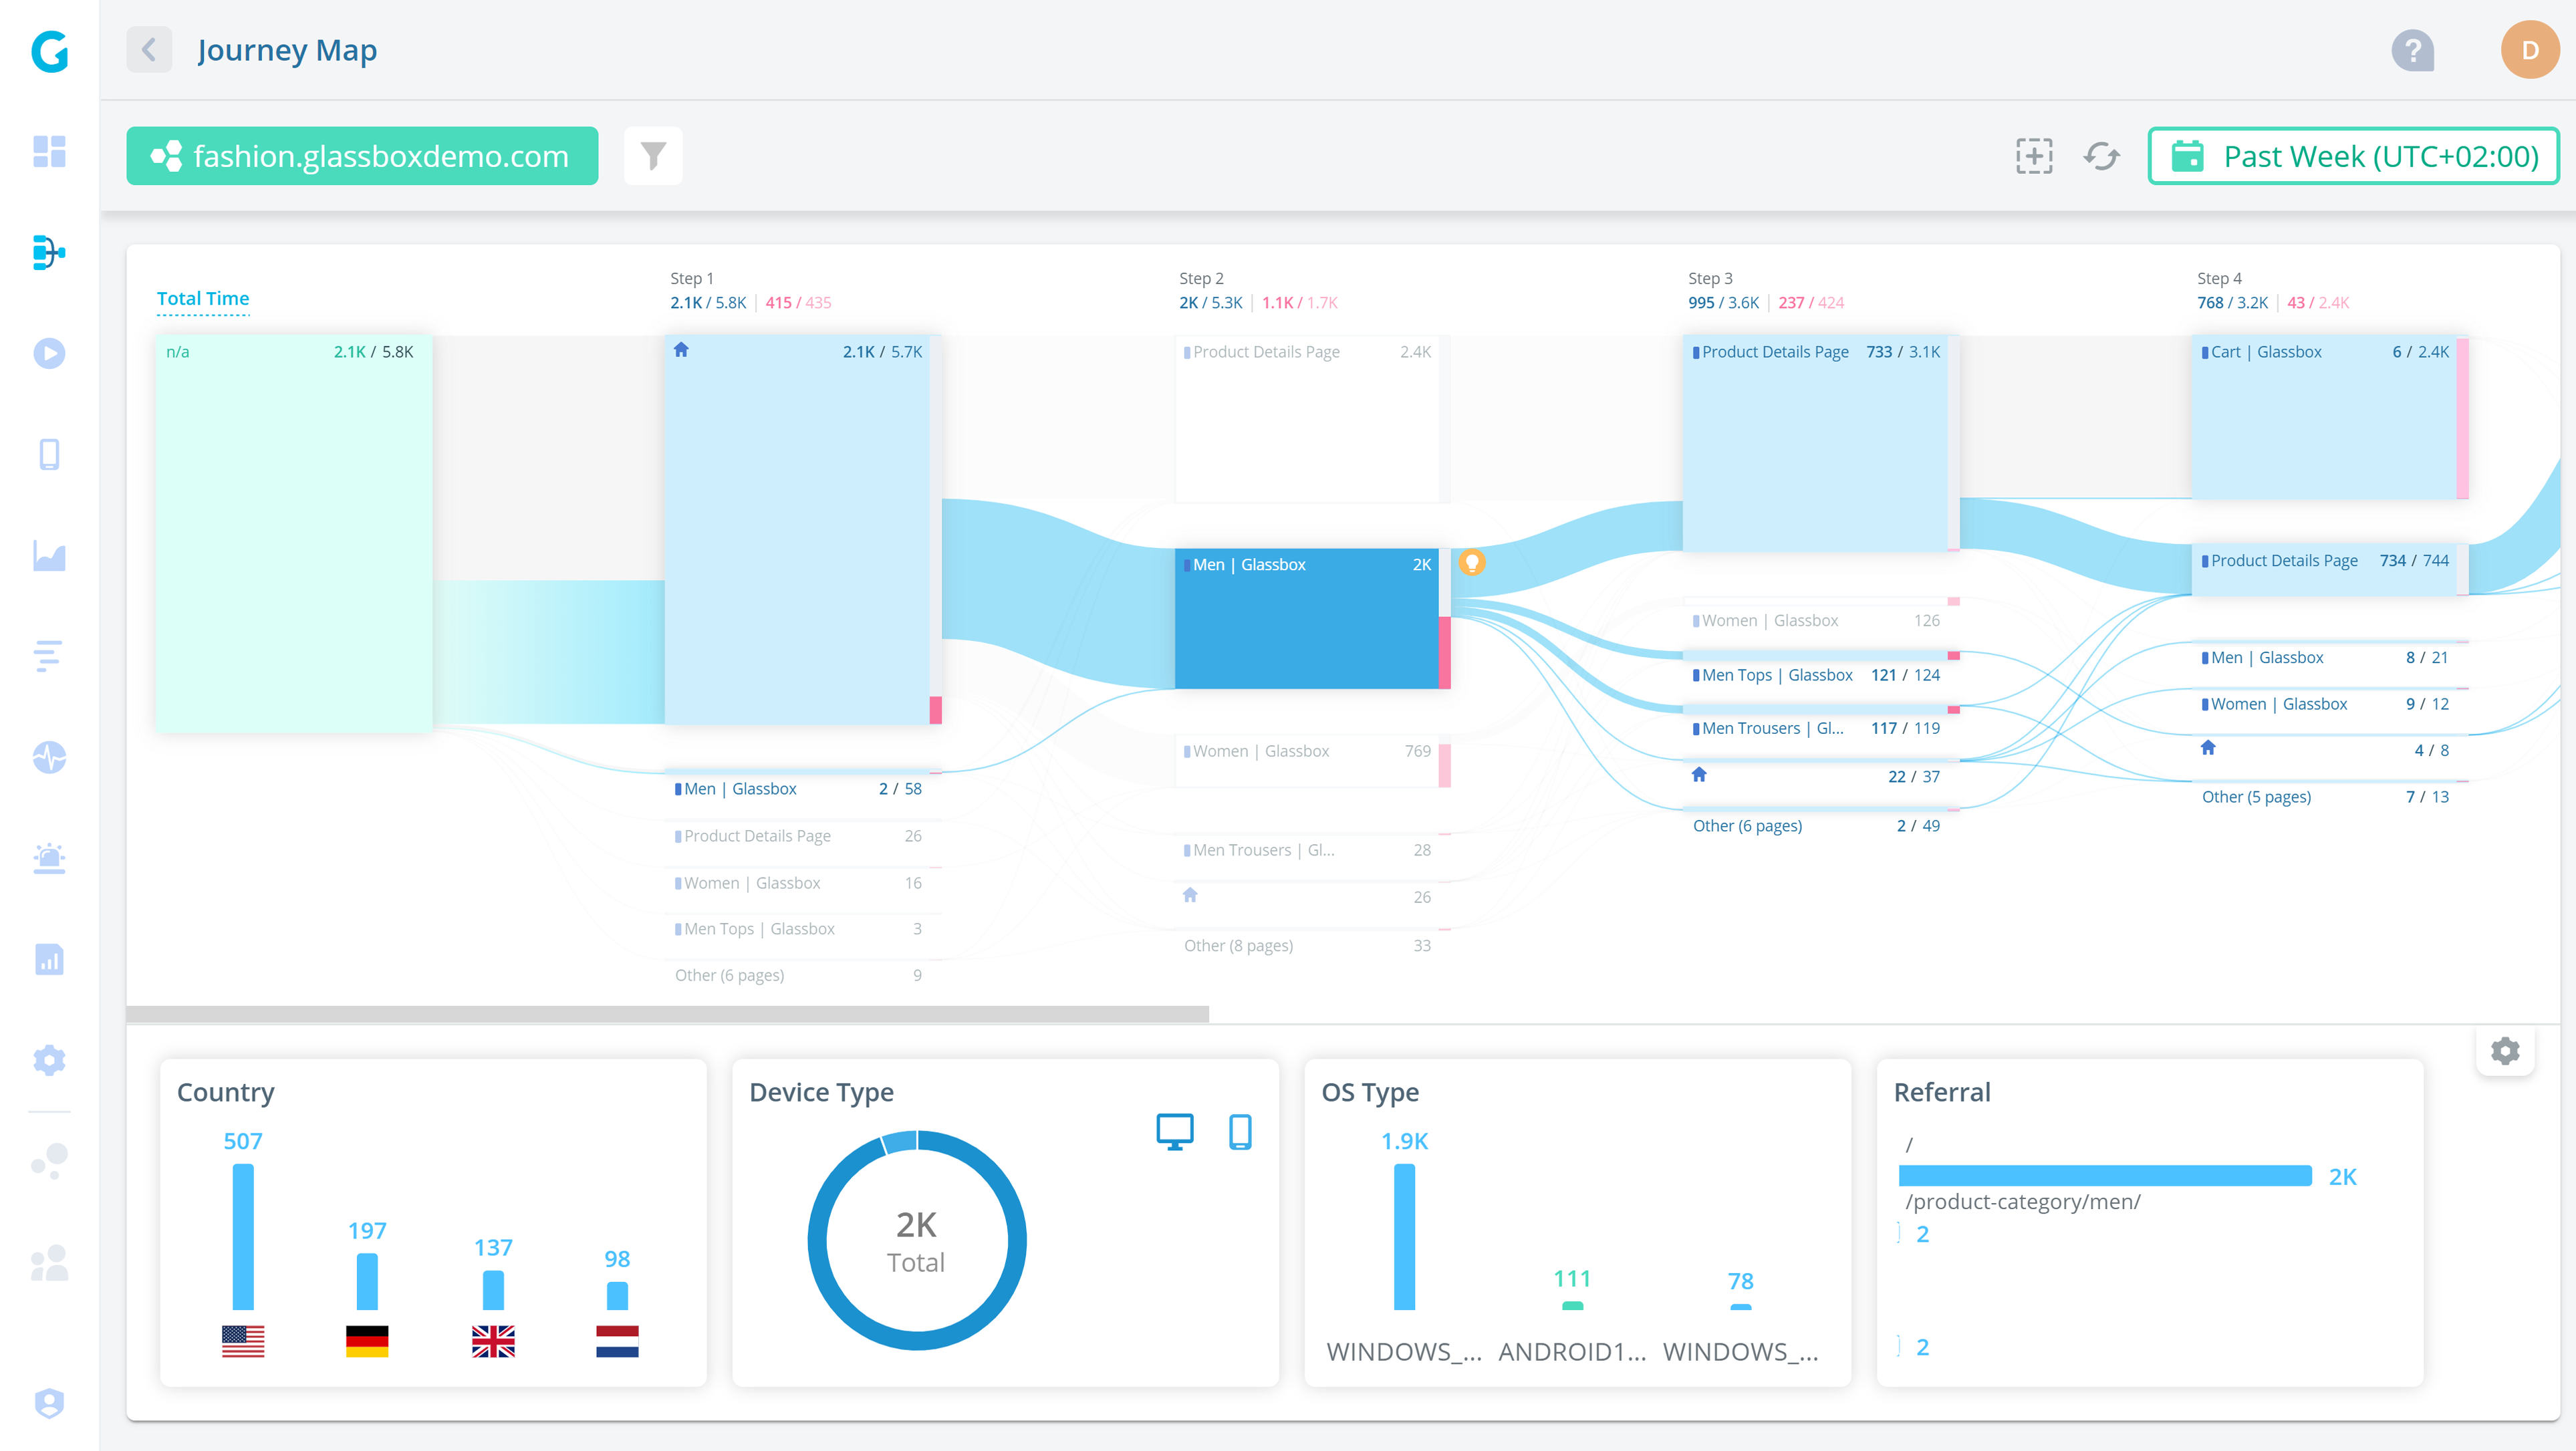
4. Glassbox
G2 Score: 4.9/5
Platform: Web/Android/iOS
Price: Paid
Glassbox is a powerful digital experience analytics platform that allows you to observe, replay, and study customers’ behavior on their mobile applications and websites in real time.
Moreover, its integration with other analytics platforms and CRM systems makes it possible for companies to blend Glassbox data with data from other sources for a comprehensive view of customer behavior.
Features
- Funnel analysis – Create ad-hoc funnels to discover why drop-offs and deviations happen.
- Crash analytics – Replicate crashes and understand what caused them.
- Performance analytics – See how software, network, OS, and device impact experience.
- Interaction maps – Understand how customers interact with each screen and element.
- Journey analysis – Visualize app journeys on an interactive map with AI insights.
Pros of Glassbox
- You can get a granularity level of system insights.
- Great session replay and user analytics that provides insight into improving UX and Product decisions
Cons of Glassbox
- You can’t compare data or stats over some time.
- Onboarding the site and learning how to navigate the tool is difficult.
Review
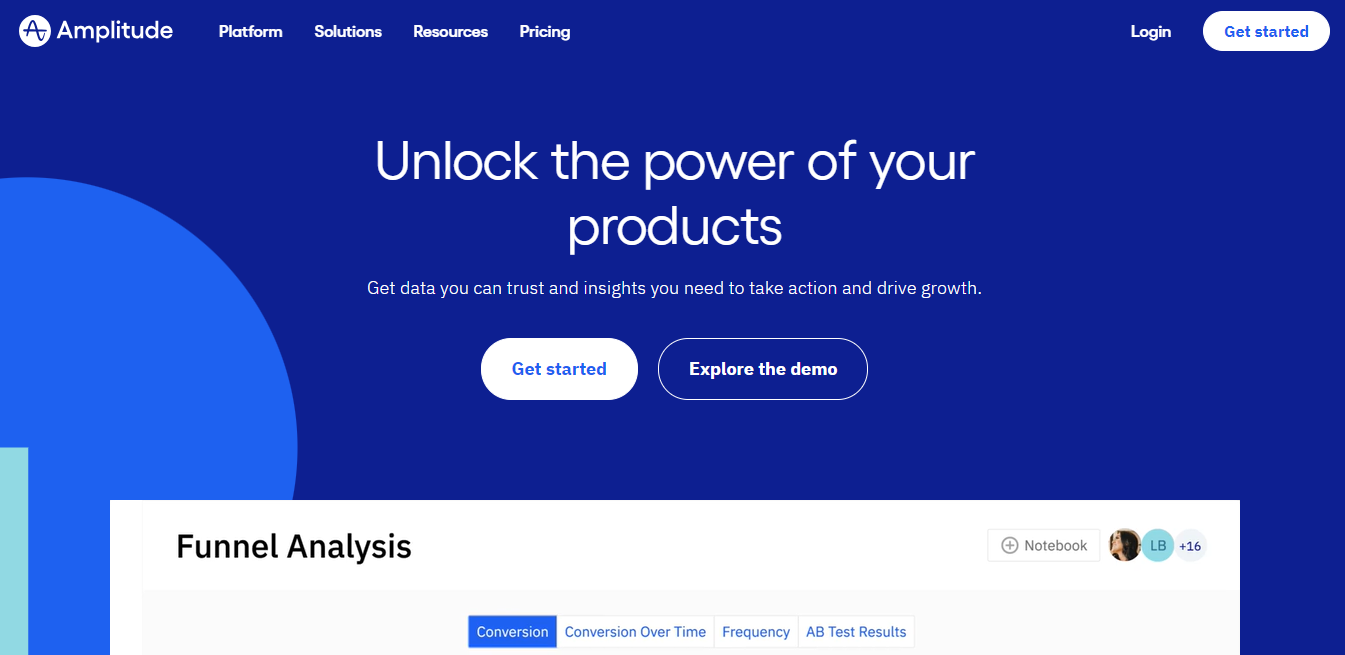
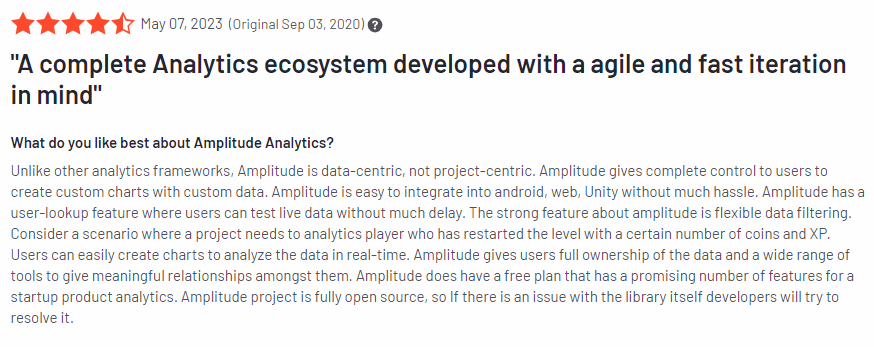
5. Amplitude
G2 Score: 4.5/5
Platform: Android/Web
Price: Free/Paid
Used by the G2 team, 25 out of the Fortune 100 businesses, Amplitude is a powerful analytics tool that enables you to understand user behavior and optimize your digital products.
With Amplitude, you can track and analyze user actions, events, and conversions, allowing for deep behavioral analysis.
Its advanced segmentation capabilities help you to identify specific user groups and understand their unique behaviors and preferences.
Amplitude’s funnel analysis helps visualize and optimize user journeys, identifying bottlenecks and areas for improvement.
The tool also offers cohort analysis to identify trends and patterns among different user groups over time.
Amplitude also provides robust data visualization and reporting features for effective communication and data-driven decision-making.
Features
- Funnel analysis – Visualize common paths users take in your product to find friction points and build a seamless experience that converts more users.
- Event segmentation – Identify what drives long-term value. Spot trends in product use by user groups, as machine learning correlates specific behaviors with conversion and retention.
- Data tables – find fast answers in user data. Compare any mix of user behaviors, attributes, or metrics to pinpoint your best acquisition channels, costs, and more.
- Retention analysis – Visualize your stickiest features and easily create user groups to understand which users return most often and why.
- User sessions – Group users by in-product behavior, then visualize every pathway in one chart to boost engagement from a bird’s eye view.
Pros Of Amplitude
- You can create custom charts with custom data.
- It has flexible data filtering.
Cons Of Amplitude
- The free plan doesn’t have a basic A/B test framework.
- Pricing is high.
Review
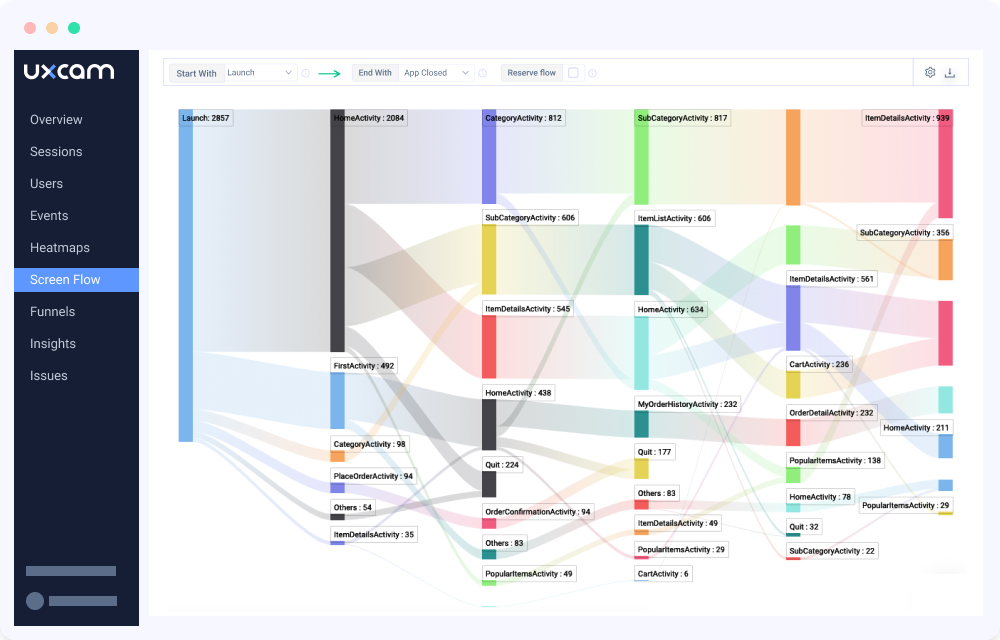
6. UXcam
G2 Score: 4.7/5
Platform: iOS / Android / React Native / Flutter / Xamarin
Price: Free trial/pricing upon request
This powerful tool for user experience analytics allows you to gain valuable insights into how users interact with your digital products.
You can capture and replay user sessions with UXcam, providing a comprehensive view of user interactions, clicks, and gestures.
Its heatmaps feature visualizes user engagement and identifies areas of interest and friction. The tool also offers user journey analysis, enabling you to track and optimize user flows and identify drop-off points.
With UXcam’s conversion funnel analysis, you can understand the user journey from start to finish and optimize conversion rates.
UXcam also provides detailed analytics and metrics, helping businesses make data-driven decisions to improve their user experience.
Features
- Take advantage of in-depth behavior analytics: With detailed analytics, including heatmaps, screen flow analysis & funnel tracking – UXCam can be your single source of truth for user behavior.
- Improve app performance: UXCam provides invaluable insights into potential user experience issues, alerting you to crashes, UI freezes, and handling exceptions that are easily preventable.
- Understand user journeys: UXCam’s tracking capabilities allow you to see the complete user journey, helping you understand how users interact with your app and identify areas for improvement.
- Customizable dashboards: UXCam’s customizable dashboards allow you to track the performance metrics that matter most to your app and easily understand how your app is performing.
Pros of UXcam
- You can look at app usage from different angles like; heatmaps, dropoffs, flow analysis, etc.
Cons of UXcam
- You need engineering to be able to create custom events.
Review

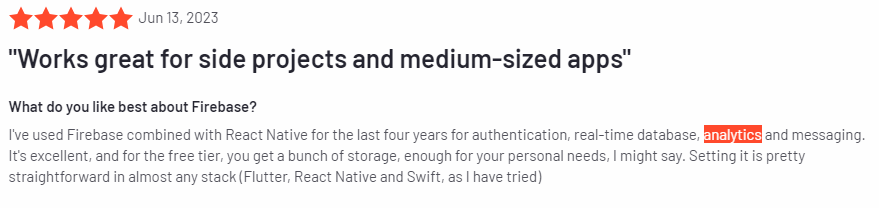
7. Firebase by Google

G2 Score: 4.5/5
Platform: Android/iOS
Price: Free/Paid
Firebase by Google is a comprehensive mobile and web development platform that offers a wide range of key features for building and managing applications.
It provides real-time database capabilities, allowing developers to synchronize data across devices in real time.
Firebase Hosting provides a fast and secure hosting solution for web apps, while Firebase Cloud Messaging allows for sending push notifications to users.
Firebase also offers a robust analytics tool, enabling developers to gain insights into user behavior, track app performance, and make data-driven decisions for app optimization.
Features
- Hosting: Firebase provides a hosting service that allows developers to host their apps on a scalable infrastructure.
- Crash reporting: Firebase includes a crash reporting feature that helps developers identify and fix issues that cause their apps to crash.
- Test Lab (for Android): Firebase’s Test Lab is a tool that allows developers to test their Android apps on various devices and configurations.
- Application performance monitoring: Firebase lets you monitor, identify and troubleshoot issues.
- Google Analytics: The mobile app version of GA is included in Firebase.
Pros of Firebase
- It has a prebuilt dashboard from where you can manage data.
Cons of Firebase
- Documentation isn’t easy to understand.
- Limited querying capabilities.
Review
8. Flurry
G2 Score: 3.9/5
Platform: Android/iOS
Price: Free
Flurry is a powerful analytics tool designed for mobile applications, offering a range of key features to help you understand and optimize user experiences on your mobile application.
It provides comprehensive app analytics, allowing you to track user sessions, retention rates, and engagement metrics.
Flurry’s robust event-tracking feature enables you to monitor specific user actions and behavior within the app.
It offers real-time crash reporting and customizable dashboards, providing instant visibility into app performance.
Flurry’s user segmentation capabilities allow you to analyze different user groups based on demographics, behaviors, and preferences.
Additionally, Flurry provides comprehensive crash reporting and performance monitoring to ensure app stability and performance.
Features
- User Journeys – It presents a full picture of how your customers use your product to inform your strategies for deeper engagement and, ultimately, more conversions.
- Audience – Flurry automatically breaks down your audience by Age, Gender, Location, and Interest Category to provide insights into who is using your mobile application.
- Funnel Analysis – Monitor key drop-off points within your app and identify the steps that are driving (or hurting) conversions. Funnels will help you understand the stickiest features in your app, or if consumers are using your application the way you intended, and pinpoint where in the funnel to make improvements.
- User segmentation – lets you group audiences based on demographics or behaviors, so you can easily analyze each segment’s unique engagement patterns. Create any custom segment you can imagine.
Pros of Flurry
- It’s free, with no paid plan.
- Easy to set up.
- Comes with prebuilt views that are useful
Cons of Flurry
- When compared to other tools, not as powerful when it comes to retention and engagement.
Review

9. Countly
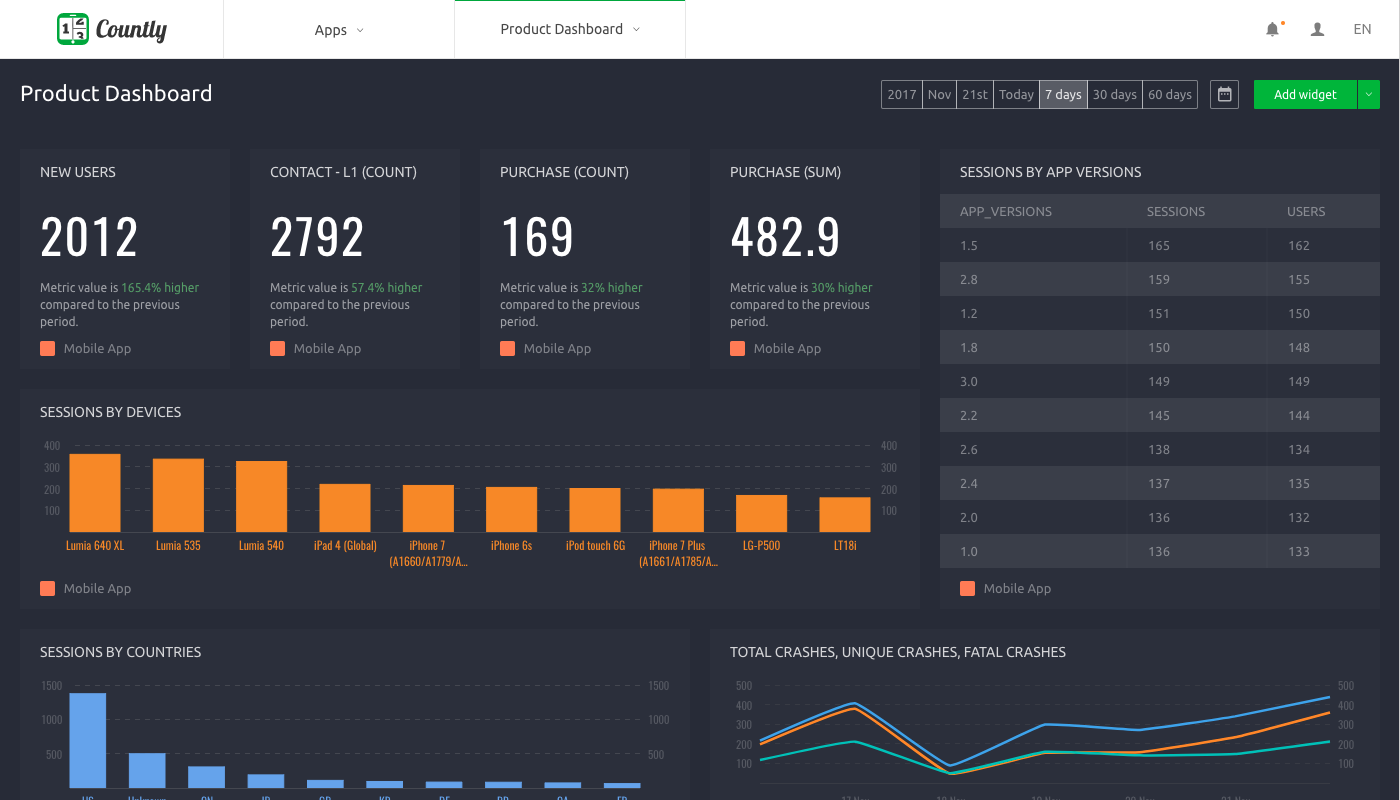
G2 Score: 4.1/5
Platform: Web/Android/iOS
Price: Free/tailored plans
This comprehensive analytics platform is designed for mobile and web applications, offering a range of key features to understand user behavior and optimize user experiences.
It provides real-time analytics, allowing you to track user sessions, active users, and engagement metrics with instant visibility.
Countly’s segmentation feature enables you to analyze user groups based on demographics, behaviors, and custom attributes, providing valuable insights for personalized targeting.
Its funnel analysis helps visualize user flows and identify conversion bottlenecks, optimizing the user journey.
Countly also offers crash reporting and error tracking, providing developers with actionable insights to improve app stability and performance. Additionally, Countly provides push notifications and in-app messaging features to engage users and drive retention.
Features
- A/B testing – Optimize the reach of your Remote Config variables and measure their impact on your app’s behavior.
- Cohorts – Group users based on their behavior and segment all your data and actions using these groups.
- Crashes/errors – Monitor the stability of your application and website in real-time and resolve crashes and errors.
- Filtering rules – Filter out the collection of specific requests, events, sessions, or properties.
Pros of Countly
- The user interface is easy to understand.
Cons of Countly
- It doesn’t have an auto-capture feature.
- You need to manually create the event’s name manually with hard coding.
Review
10. Upland Localytics
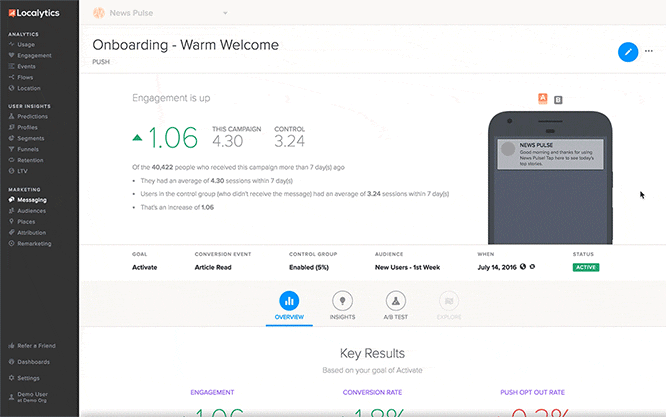
G2 Score: 3.9/5
Platform: Android/iOS
Price: Free/Paid
Upland Localytics is a marketing solution for mobile apps. It offers a robust push notification capability. It’s a great tool for tracking retention metrics & attribution models across your apps.
Features
- User segmentation – You can segment users into various groups, analyze them based on their shared behavior, and make adjustments.
- User path tracking – See how users move through your app and identify their desire paths.
- Demographics – you can break down your app users by age, sex, location, and other basic demography.
- Custom event tracking – Create custom events and track them to get a better granular understanding of your users.
Pros of Upland Localytics
- You can quickly build complex segmentation queries.
- The setup process is smooth and quick.
Cons of Upland Localytics
- Sometimes it’s not possible to aggregate views across Android and iOS platforms.
Review

Benefits Of Mobile App Analytics Tool
Mobile app analytics tools offer numerous benefits that can greatly impact businesses in the digital landscape.
Let’s delve into some key advantages of using these tools:
1. Enhanced User Experience:
Mobile app analytics tools provide valuable insights into user behavior, allowing you to better understand how users interact with your apps.
This knowledge enables you to identify pain points, optimize user flows, and enhance the overall user experience. By making data-driven improvements, you can ensure that their app meets user expectations, resulting in higher satisfaction and increased usage.
2. Increased User Engagement:
By leveraging mobile app analytics, you can analyze user engagement metrics such as session duration, click-through rates, and in-app actions.
This information helps identify features or content that resonate most with users, enabling businesses to optimize their apps for higher engagement.
You can keep users engaged through personalized experiences and targeted messaging, fostering long-term loyalty and repeated app usage.
3. Improved Retention Rates:
Mobile app analytics tools allow you to closely monitor user retention rates and understand factors contributing to churn.
Businesses can identify opportunities to improve user retention by analyzing user behavior patterns. Businesses can actively retain users and reduce churn rates by implementing personalized notifications, tailored recommendations, and proactive customer support.
4. Informing Marketing Strategies:
Mobile app analytics tools provide crucial insights into the effectiveness of marketing campaigns and user acquisition efforts.
By tracking attribution, you can understand which marketing channels, campaigns, or ad networks are driving app installations and conversions.
This data allows informs your strategy in allocating marketing budgets effectively, optimizing campaigns, and targeting specific user segments to maximize ROI.
5. Streamlined Workflow:
Mobile app analytics tools streamline the process of data collection, analysis, and reporting.
Instead of manual tracking and complex data management, these tools automate the process, saving time and resources.
The intuitive dashboards and reports offered by analytics tools enable businesses to quickly access and interpret data, facilitating data-driven decision-making and faster optimization cycles.
Final Thoughts
Analyzing user behavior to optimize their experiences is a must if you’ve got an application. This is the only way you can guarantee an increase in conversions, retention, and engagement.
These mobile analytics tools enhance the user experience, boost in-app engagement, and ultimately, increase your app’s competitiveness.
If pricing is the issue, among the tools mentioned, some have a free plan, while the paid plan for others is relatively inexpensive.


