
Imagine you’re a small business owner subscribing to a cloud-based software suite to keep your team organized. At first, the pricing seemed straightforward—pay a flat monthly fee, and everyone gets access.
But then, as your business grows, you notice some employees hardly use the software while others rely on it daily. Wouldn’t it be great if your costs reflected the actual usage instead of a one-size-fits-all model?
That’s all the new age of SaaS pricing strategy is all about—where the major focus is on meeting customer expectations and making it as streamlined for them as possible.
In this article, we’ll explore the latest state SaaS pricing strategy, statistics, and trends shaping it, giving you a closer look at what’s happening in this industry.
Overview of SaaS Pricing Models
To make sense of the data on SaaS pricing trends, you should know all the pricing models SaaS businesses can have.
Here are some options:
- Fixed Pricing: Fixed pricing is straightforward. Customers pay a set fee for a specific level of service or a particular product. This simple and predictable model makes it easier for customers to budget expenses.
- Tiered Pricing: Tiered pricing offers customers several options at different prices. Each tier provides increasing levels of features and services. This model allows companies to cater to a broader audience by addressing various customer needs.
- Per-User Pricing: Per-user pricing charges customers based on the number of users accessing the software. This model is popular among teams and organizations where collaboration is essential.
- Usage-Based Pricing: Usage-based pricing, often called pay-as-you-go, charges customers based on their actual service usage. This flexible model is for customers who prefer to pay only for what they use.
- Freemium Models: Freemium models offer a basic version of the software for free, with the option to upgrade to a premium version with more features. This model is excellent for attracting new users and converting them into paying customers.
SaaS Pricing Market Trends
- Price Inflation: The year-over-year price inflation for SaaS products is currently at 8.7%. (Source)
This means that, on average, SaaS subscriptions and services are almost 9% more expensive than just a year ago.
This could mean higher business costs across various software solutions, like CRM tools, project management software, and other cloud-based services. If you’ve noticed your monthly or yearly subscription fees creeping up, this inflation trend could be why.
Increase in spending: Businesses spend an average of $7,900 per employee annually on SaaS tools, marking a 27% increase over the last two years. (Source)
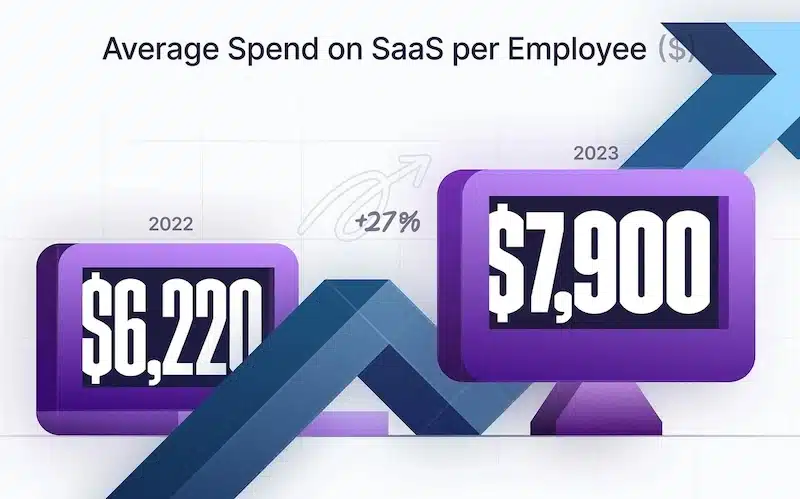
Companies are investing heavily in these tools, likely because they’ve become essential for day-to-day operations. At the same time, this means that budgeting for software is becoming a larger part of overall expenses.
- Increasing Costs: According to recent data from McKinsey, about 50% of all software companies are gearing up to raise their prices and cut back on discounts over the next few months. (Source)
Companies seem pressured to adjust their pricing strategies to maintain profit margins or manage rising costs.
For SaaS customers, this might mean fewer discounts and some price hikes soon. This trend reflects how companies respond to economic shifts and stay competitive while balancing their revenue goals.
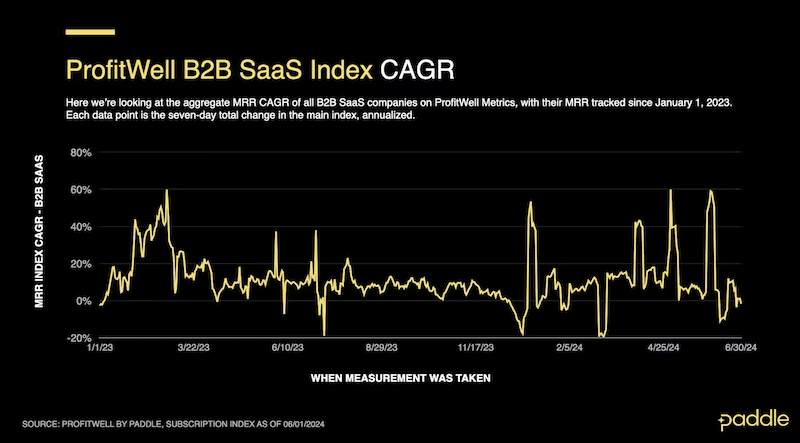
B2B Growth Rates: The Compound Annual Growth Rate (CAGR) for B2B SaaS has stabilized at 12.2% in the first half of 2024, down from nearly 50% in early 2022. (Source)
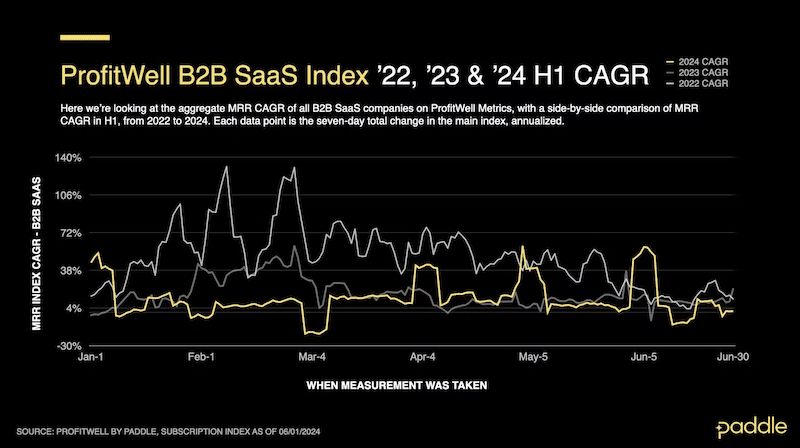
This figure reflects a more stable market environment after consistent fluctuations due to economic pressures. During the pandemic, there was a big rush as businesses needed digital tools fast, pushing growth to incredible highs. But now, that demand has leveled out, and the market isn’t expanding at the same rapid pace.
So, while 12.2% might seem lower compared to the massive 50%, it’s still decent. It indicates the market has found a more sustainable, steady pace, which is a good sign of stability rather than explosive, unpredictable growth.
- Future Projections: Forecasts suggest an 11% CAGR for B2B SaaS and an 8% CAGR for B2C SaaS through 2024, indicating a return to steady growth after recent volatility. (Source)
Statistics on SaaS Pricing Models
- Usage-Based Pricing (UBP): A significant shift towards UBP is evident, with 38% of SaaS companies billing based on actual software usage.
This model allows companies to align pricing with the value customers derive from their services.
For example, if a business uses a software tool heavily for one month for a big project, it might pay more that month. But if it doesn’t use it much the next month, its bill drops. It makes sense, right? It feels more fair and encourages companies to only pay for what they need.
This SaaS pricing model encourages companies to continuously improve their products because the more valuable the service is, the more customers will use it, and the more they’ll pay.
- Companies With Usage-Based Pricing Witnessing Growth: Companies employing usage-based pricing have reported significant revenue growth. For instance, Snowflake, which utilizes a tiered consumption-based model, projected an increase of up to $21 million in product revenue for Q4 2023 due to this pricing strategy. (Source)
It makes sense when you think about it: usage-based pricing is flexible, which attracts customers who might not want to commit to a higher, flat-rate plan. Instead, they can start small and scale up their spending as their needs grow. This, in turn, creates steady revenue growth for the company.
- Per-Seat Pricing: Approximately 40% of software companies still utilize per-seat pricing but are considering shifts towards more flexible models as customer preferences evolve. (Source)
As customer preferences change, businesses are realizing that they might need to offer more flexible pricing options. It makes sense since per-seat pricing can be pretty rigid—if a customer has to pay for every user, it can quickly get expensive, especially for larger teams.
- Tiered Pricing Remains Popular: This model remains the most widely adopted, with companies typically offering an average of 3.5 tiers to accommodate different customer segments. (Source)
Tiered pricing is still the go-to strategy for most SaaS companies. It’s all about giving customers a few different options to pick from, usually around three to four tiers.
Why this pricing strategy still remains the go-to choice for SaaS companies is because each tier caters to different needs and budgets, so it can work for everyone from small startups to large enterprises.
- Flat Rate Pricing Usage: While simple and predictable, flat rate pricing is less common in mainstream SaaS offerings due to its lack of flexibility. It typically appeals to niche markets where customer needs are uniform.
- Customer Expectations: Nearly 8 out of 10 SaaS companies are planning to leverage usage data to enhance customer experience and pricing strategies. (Source)
This number reflects a growing trend toward personalization in pricing based on user behavior.
Instead of a flat rate or a one-size-fits-all model, more companies are experimenting with personalized pricing that reflects how much the customer is actually using the product. It’s all about being fairer to the customer and making sure they’re only paying for what you need.
Conclusion: Navigating the Future of SaaS Pricing
After forever using the one-size-fits-all, the future of SaaS pricing is changing. With more competition, businesses are now focusing more on customer experience and using the pricing model that caters to their individual customer base.
From usage-based models to tiered and per-user pricing, companies are trying to strike a balance between customer satisfaction with revenue goals. The trends and statistics we’ve covered show a clear shift towards flexibility and personalization, which means maintaining customer satisfaction while keeping profits intact.
The bottom line? SaaS companies that can adapt their pricing strategies to offer greater customer value will come out on top. And for SaaS users, these changes mean more choices, fairer costs, and ultimately, a better experience tailored to how they work.


