
At Invesp, while hiring for a senior UX/UI position, we screened 20 resumes, conducted 10 phone interviews, and held one face-to-face interview.
Despite impressive design claims, the candidate struggled with usability guidelines and when we asked—how do you measure the usability of a product you created?
Complete silence.
The basics of CRO lie in measuring usability. Without it, we can’t design and offer a superior visitor experience. It also improves user satisfaction by providing an intuitive interface, reduces errors, and lowers support costs.
A product with poor usability can lead to user frustration and lost conversions, making usability an enhancement and a fundamental element.
While data is essential, turning it into actionable insights requires a deep understanding of usability. This article will explore the fundamentals of usability and how to track usability metrics.
Usability Framework
According to the usability framework, “usability is a multidimensional concept that aims to fulfill a certain set of goals, mainly effectiveness, efficiency, and satisfaction,” and without these goals, usability cannot be achieved.
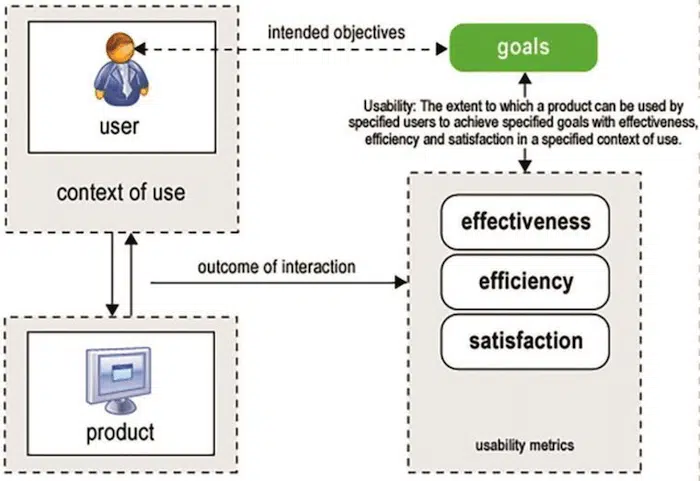
Here’s a brief overview of all the major core components of usability testing and how they relate to the overall user experience:
- Effectiveness: This term refers to the accuracy and completeness of the user goal achievement. It’s measured by factors like:
- Success rate or completion rate: The percentage of users who successfully complete a task.
- Error rate: The number of errors users make while using the system.
- Task time: The average time it takes users to complete a task.
- Efficiency: Refers to the resources exhausted by users to ensure the accurate and complete achievement of the goals. Key metrics include:
- Task time: Again, it is related to how quickly users can complete tasks without errors.
- Number of actions: The steps users take to complete a task.
- Learnability: How quickly users can learn to use the system.
- Satisfaction: It refers to the subjective thoughts of the user regarding their attitude, level of comfort, relevance of application, and the acceptability of use. It’s often measured through:
- User surveys: Gathering feedback on user attitudes and opinions.
- Observation: Watching users interact with the system to identify pain points and positive experiences.
- System usability scale (SUS): A standardized questionnaire to measure perceived usability.
How well a product works depends on where and how it’s used, who’s using it, and what they’re using it with. To measure how usable a product is, we look at how well people can use it to reach their goals, how much effort it takes, and how happy they are with it.
In light of the three goals mentioned earlier, we’ll review the different key usability metrics used to measure each goal. We’ll focus on measuring how often users can successfully complete tasks, as this gives a good overall picture of the product’s performance.
Usability Metrics: Measuring How Well Your Product Works
Effectiveness Metrics: How well users achieve their goals.
You can measure effectiveness using two usability test metrics:
Success rate (also called completion rate)
Success rate or completion rate refers to the percentage of users who were able to complete the tasks successfully.
Despite not revealing how tasks were performed or why users fail, this metric remains critical and is at the core of usability.
The success rate metric can be measured by assigning a binary value of 0 and 1 to the users, where 1 is assigned to those who successfully complete the task and 0 to the ones who fail to do so.
To calculate your success rate, divide the total number of correctly completed attempts by the total number of attempts and multiply by 100.
The completion rate (or success rate) is easy to measure but has a pitfall: users may stop midway or complete tasks incorrectly. How do you score partial success?
For example, a user’s task is to order a box of dark chocolates with a card for Mother’s Day. Scoring might seem simple: success if the mother receives the chocolates and card, failure if she doesn’t.
But consider these scenarios:
- I ordered a box of chocolate but not the dark one (white, milky, or a variety of these), along with the card.
- Ordered the right chocolate box without a gift card
- Ordered more than one box of chocolate by mistake, and a gift card
- Ordered a box of chocolate but didn’t add delivery information or an address
- Ordered a box of chocolates and a gift card successfully but to the wrong address
Each scenario shows partial success or failure, requiring evaluators to use personal judgment. Different evaluators may score these scenarios differently. To mainstream scoring, determine the important aspects of the task and assign scores accordingly.
Success rate remains the simplest usability metric and the easiest among the whole range of these usability signals, mainly because it’s quick and easy, does not require much preparation and time to collect, and, most importantly, helping with tracking usability metrics and progress within your system.
However, as one of the general areas commonly used by marketers and designers to see the big picture of how well their system is doing at the level of user experience, this does not change the fact that it remains subjective.
The Number of Errors
This metric provides an idea about the average number of times where an error occurred per user when performing a given task.
These errors can be either slips, where the user accidentally types the wrong email address or picks the wrong dates when making a reservation or booking a flight, or mistakes, where the user clicks on an image that’s not clickable or even double-clicks a button or a link intentionally.
Normally, any user of any interactive system may make errors, where 2 out of every 3 users err, and there is absolutely no such thing as a ‘’perfect’’ user interface anyway. The rationale behind using this metric is not to eliminate errors but rather to lessen their numbers within the system.
To help you measure and ensure obtaining great diagnostic results, it is highly recommended to set a short description where you give details about how to score those errors and the severity of a certain error to show you how simple and intuitive your system is.
Efficiency Metrics: How much effort users put in.
Time-Based Efficiency
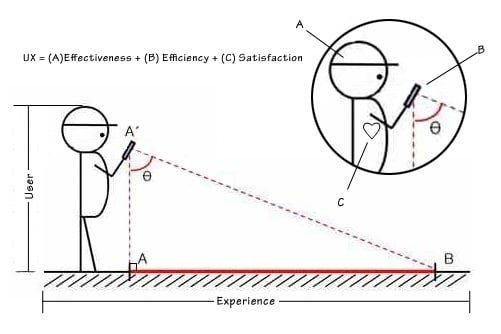
Referred to as time on task, this metric measures the time the user spends completing the task or the speed of work. Consequently, this means that there is a direct relationship between efficiency and effectiveness, and we can say that efficiency is actually the user’s effectiveness divided by the user’s time spent.
I will use an example to simplify the calculation of the time-based efficiency.
Let’s consider, for example, that we have 3 different users performing the same task. Two managed to complete it successfully in a considerable time—-2,3 seconds, respectively—while the third user took 7 seconds and never finished the task.
Now that we know the number of tasks is N=1 and the number of our users is actually R=3, and we also know the time spent on each one, it becomes easy to determine the value of our Time-Based Efficiency.
- N= Number of tasks (in this case N=1)
- R= Number of users (in this case R=3)
- Nij = The result of task i by user j; if the user successfully completes the task, then Nij = 1. If not, then Nij = 0
- Tij = The time spent by user j to complete task i. If the task is not successfully completed, then time is measured till the moment the user quits the task
Using the time-based efficiency equation, we end up with something like this:
- User 1: Nij = 1 and Tij = 2
User 2: Nij = 1 and Tij = 3
User 3: Nij = 0 and Tij = 7
Time-based Efficiency = (1/2+1/3+0/7)/1*3 = 0,71 goals/sec
The Overall Relative Efficiency
This is actually measured through users who successfully completed the task in relation to the total time taken by all users.
Let’s consider that we have 2 users, and each one is supposed to complete a different task. The first user has successfully completed the task (1) yet failed to complete the task (2). The second user failed to complete task (1) but completed task (2) successfully.
In this case, the overall efficiency can be calculated as the following: The Overall Relative Efficiency = E = ((1*1+1*1)/ (2*2)) *100% = 50%
Satisfaction Metrics: How users feel about the experience.
Post Task Satisfaction
Once your users have finished the task, and it doesn’t matter whether they complete it successfully or not, it’s time to hand them over a questionnaire to have an idea about the difficulty of the task from the user’s point of view.
Generally, these tasks consist of 5 questions, and the idea behind them is to give your users a space to judge the usability of your system and measure user satisfaction.
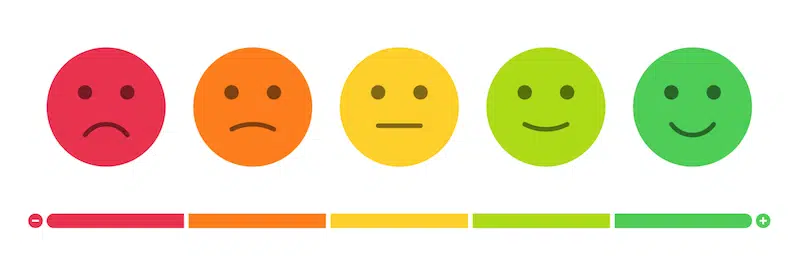
Task Level Satisfaction
This metric helps investigate users’ general impressions of the system.
To measure the level of satisfaction, you can use the smiley scale method. In this method, the user is expected to choose one of the five smileys to reflect user interaction satisfaction or lack of satisfaction, enabling you to track test-level satisfaction.
Over to You!
In light of the conceptual framework we discussed earlier, the user experience is highly influenced by everything around it.
In the digital world, especially when it comes to user experience and system usability, it’s all about how accurate and exact your numbers and stats are.
Since there’s so much qualitative data and many uncontrollable variables, usability metrics are a great way to combine this data in a quantitative and qualitative manner. This helps you understand your system’s performance against its objectives and goals, ultimately providing a better user experience.
Once you have collected the metrics, it’s time to use them to form a conclusion about your system’s overall usability and make sound, data-driven decisions about future changes to improve the user experience.


