
On 1st July 2023, Universal Analytics will be going away.
This isn’t news to any marketer, and that’s because there has been an announcement from Google and several posts on social media; when you log into your Analytics, you see the same message on a banner with a countdown timer.
So why this article? Isn’t it coming late?
The answer is no.
Not many marketers know what to expect when they migrate to Google Analytics 4. They don’t know what makes it better, its key features, and best practices for utilizing GA4.
We cover all of that in this article.
Let’s get started.
Brief History Of Google Analytics 4
31st July 2019, Google introduced a significant shift in the world of analytics with the unveiling of Google Analytics 4 (GA4).
GA4 was not just an update to the existing Google Analytics platform but a complete reimagining of how businesses can gain insights from their data.
This new iteration was initially introduced as “App + Web” to emphasize its expanded capabilities in tracking mobile apps and websites.
The decision to merge app and web tracking into a single platform was driven by consumers’ growing usage of mobile devices.
With the increasing usage of smartphones and mobile apps, businesses needed a comprehensive analytics solution that could offer insights into user interactions across various digital touchpoints. Google recognized this need and aimed to provide marketers with a unified view of their audience’s journey.
However, after the initial introduction of GA4 as App + Web, Google decided to shelve its development temporarily and release it later. The main reason behind this decision was to refine and enhance the capabilities of GA4 based on feedback from early adopters and industry experts.
Google wanted to ensure that GA4 delivered the best possible analytics experience, addressing any initial limitations or concerns raised during its initial rollout.
During this interim period, Google continued supporting and enhancing the traditional Google Analytics platform while gathering valuable insights and user feedback to improve GA4.
The decision to delay the full release allowed Google to refine the new features, make necessary adjustments, and ensure a smooth transition for businesses migrating from the older version of Google Analytics.
Finally, after an extended period of development and refinement, in mid-October 2020, Google officially released Google Analytics 4 as a mature and robust analytics platform.
With its advanced tracking capabilities, machine learning-powered insights, and a focus on privacy-centric measurement, GA4 aims to empower businesses with a comprehensive understanding of user behavior, enabling them to make data-driven decisions for growth and optimization.
Here’s the Google Analytics 4 timeline (from release date till deprecation).
- 31st July 2019 – Beta GA4 launch date as App + Web
- Mid-October 2020 – Official GA4 release
- 16 March 2022 – Google announces 2023 UA deprecation dates
- 30th June 2022 – Advised GA4 deadline for adoption
- 1st July 2023 – Universal Analytics deprecation date
- 1st July 2024 – Universal Analytics 360 deprecation date
What Makes Google Analytics 4 Unique?
Three key technologies make GA4 truly distinctive from its predecessors: Firebase Analytics, Google Signals, and the Global site tag.
Let’s explore them;
1. Firebase Analytics:
One of the standout features of GA4 is its integration with Firebase Analytics.
Firebase is Google’s app development platform that offers a range of tools and services to help developers build and grow their apps (like cloud messaging, cloud storage, hosting, and testing).
By integrating Firebase Analytics with GA4, Google has enabled businesses to gain comprehensive insights into user behavior across web and mobile app experiences.
With Firebase Analytics, GA4 provides deep app-specific insights like app engagement, user retention, and in-app conversion tracking.
Also, the integration of Google Analytics across Firebase features provides you with unlimited reporting for up to 500 distinct events that you can define using the Firebase SDK.
This integration allows businesses to understand the complete user journey, whether it begins with a website visit or an interaction within a mobile app.
By unifying app and web analytics, GA4 empowers businesses to make data-driven decisions that drive growth and enhance user experiences.
2. Google Signals:
Google Signals is another powerful technology integrated into GA4 that unlocks enhanced cross-device tracking and user identification capabilities.
In the era of multi-device usage, tracking users across different devices and understanding their interactions has become increasingly important.
Google Signals utilizes anonymized data from users who have opted into personalized ads, providing insights into cross-device behavior.
By leveraging Google Signals, GA4 can deliver more accurate and comprehensive user insights, allowing businesses to understand how users engage with their brand across various devices.
This technology helps marketers gain a holistic view of user behavior, enabling them to create personalized experiences and targeted campaigns that resonate with their audience.
Note: Google Signals is only available to users who have turned on Ads Personalization. When Ads Personalization is turned on, Google can develop a holistic view of users interacting with an online product or service from multiple browsers and multiple devices.
This is how you turn on Ads Personalization:
Sign in to Analytics. Click Admin. In the Property column, click Data Settings > Data Collection. Under Advanced Settings to Allow for Ads Personalization, expand the panel.

3. The Global Site Tag:
The Global Site Tag is a foundational component of GA4 that simplifies the implementation and tracking process.
Previously, implementing Google Analytics required multiple tracking codes and tags for different functionalities, making it complex and time-consuming.
However, GA4 streamlines the implementation process with the Global Site Tag, a single, unified tag that covers all tracking aspects.
The Global site tag eliminates the need for multiple tags and simplifies the tracking process for various analytics features, including event tracking, page views, and enhanced ecommerce.
With this unified approach, businesses can easily implement GA4 across their entire digital ecosystem, saving time and resources while ensuring accurate and consistent data collection.
Key Features of Google Analytics 4 Marketers Should Be Aware Of.
1. Event-based Data Model:
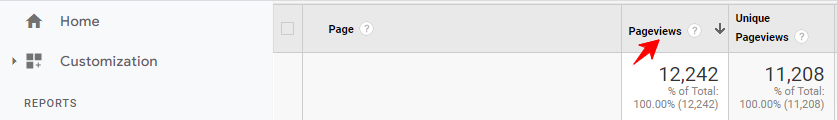
One of the significant changes in GA4 is the shift from traditional pageview-based tracking to an event-based data model.
Here’s what the page view model currently looks like;
Here’s the event model and some conversion metrics already created;
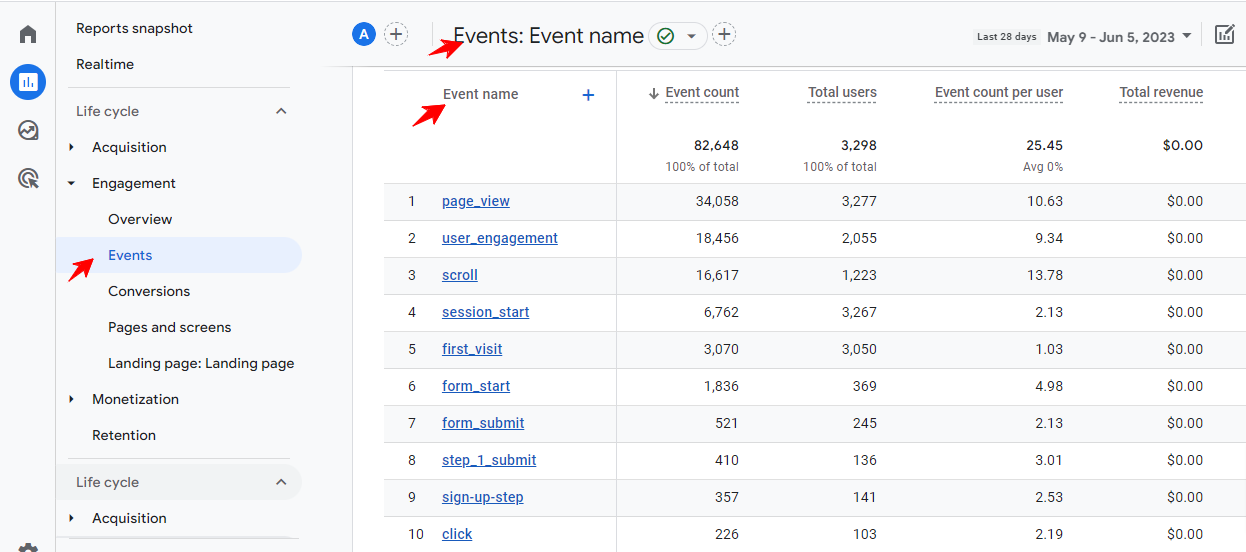
This shift recognizes the importance of tracking specific user interactions beyond page views.
Events can be customized to capture a wide range of user actions, such as button clicks, video plays, form submissions, or in-app interactions. This event-based tracking gives marketers granular insights into user behavior and engagement, enabling them to measure and optimize specific interactions that drive conversions.
2. Enhanced Measurement Capabilities:
GA4 offers enhanced measurement capabilities superior to its predecessors.
Here are some of the user interactions you can measure more in-depth;
-
Page views.
The default setting in the data streams section under admin is that the option for page views is already selected and cannot be turned off. You will notice this when you navigate to that section.
Nevertheless, there are additional configuration settings that provide you with the opportunity to explore page views further.
With this configuration, you have the ability to choose whether you want to track browser history events or not.
These events are typically relevant for single-page websites or applications. They occur when the page’s URL changes without reloading the page itself.
This means that a visitor might have been directed to a specific section of the website, or new content might have been loaded dynamically, resulting in a URL change while the page remains unchanged.
If you would rather not track these events, you can simply uncheck the checkbox to disable them.
-
Scrolls
With enhanced measurement, scroll tracking allows you to monitor and analyze user scrolling behavior on your website or app.
It provides insights into how users interact with your content and their engagement levels and helps you optimize the user experience.
Here’s a quick rundown of what you need to know about scroll tracking in GA4:
- Tracking Scroll Events: GA4 captures, and records scroll events as users navigate through your website or app. These events track when users scroll a certain portion of the page (90%), indicating their engagement and interaction with the content.
- Scroll Depth: By default, in GA4, Google only tracks 90% of scroll depth. It helps you understand how much of your content users consume and if they fall off before they get to the 90% mark. If you want to set up scroll events for lesser thresholds, you have to set up custom events using the global site tag or Google Tag Manager.
- Event Measurement and Analysis: Scroll events are included in GA4’s overall event measurement framework, allowing you to analyze scroll data alongside other user interactions and events. This comprehensive view helps you understand how scrolling behavior correlates with other metrics and goals.
- User Engagement Insights: You can gain insights into user engagement and content consumption patterns by tracking scrolls. For example, you can identify if users quickly skim through the content or spend more time scrolling through specific sections. This information can guide content optimization and improve the user experience.
Site search
Enhanced measurement allows you to drill deep into how users conduct and interact with the search function on your site.
If a visitor performs a site search on your website, and during that search, the URL of the website contains a certain query parameter, and that query parameter contains the search query, I mean the actual search keyword that your visitor is using.
Then that can be tracked as a search event, which can be sent to your Google Analytics property.
Here’s how the site search feature works with enhanced measurement in GA4:
- Tracking Search Queries: When a user performs a search on your website, GA4 captures the search query entered by the user.
- Search Term Analysis: GA4 collects and reports visitors’ search terms, allowing you to analyze the most common or popular search queries. This information helps you understand user intent and identify trends or patterns in user behavior.
- Search Engagement Metrics: GA4 provides engagement metrics related to site search. These metrics include the number of searches performed, the number of search refinements (when users modify their search query), and the number of search exits (when users leave the site after performing a search).
- Search Conversion Tracking: GA4 allows you to track conversions that occur due to a site search. For example, if a user searches for a product and makes a purchase, you can attribute that conversion to the specific search term.
- Analysis and Insights: By analyzing site search data in GA4, you can gain insights into user preferences, identify potential content gaps, and optimize your website’s search functionality. Understanding what users are searching for can help you improve the user experience, enhance content relevance, and drive conversions.
-
Video engagement
With enhanced measurement, the video engagement metric provides valuable insights into how users interact with videos on your website or app.
It lets you understand user engagement levels, track video performance, and optimize your content strategy.
Here are key aspects of the video engagement metric in GA4:
- Video Starts: GA4 tracks the number of times users initiate video playback on your website or app. This metric helps you gauge the overall popularity of your video content and identify which videos attract the most attention.
- Play Rate: The play rate measures the percentage of visitors who start playing a video after encountering it. It indicates how compelling or engaging your video thumbnails, titles, or descriptions are in capturing user interest.
- Average Engagement: GA4 calculates the average engagement time, which reflects the average duration users spend watching a video. This metric helps you understand user behavior and identify videos that generate higher engagement or retention rates.
- Video Exits: Video exits represent the number of times users leave the video before it finishes playing. Analyzing video exits can provide insights into potential areas of improvement in video content or delivery, such as optimizing video length or addressing user drop-off points.
- Video Completion Rates: GA4 tracks the percentage of users who watch a video to completion. This metric helps you identify which videos have a higher retention rate and successfully capture and retain user attention.
- Conversions and Goal Tracking: GA4 allows you to set up conversion tracking for video-related goals. For example, you can track conversions such as video views, sign-ups, or purchases that result from users engaging with your videos. This helps measure the impact of video content on desired actions.
Note: This works only for embedded YouTube video players on your site.
Also, those YouTube videos should have the JavaScript API enabled in the source code.
The fact is, this doesn’t always happen, and since there are very many nuances related to you to video tracking on your website, this video engagement event will not cover all the situations.
So in many cases, you still might need to work with Google Tag Manager to set up a measurement that covers all video plays on your site.
-
File downloads
If a visitor clicks a downloadable link that is related to a certain file, then enhanced measurement will send an event about that click link to Google Analytics.
This measurement feature tells you how users interact with your files if they find them useful enough to view offline.
Here’s a quick rundown of how file downloads tracking works in enhanced measurement;
- Tracking File Downloads: GA4 captures and records when users initiate the download of a file from your website or app. This includes various file types such as PDFs, documents, spreadsheets, images, or any other downloadable content.
- File Download Events: GA4 generates events to track file downloads. These events contain information about the downloaded file, such as the file name, file type, and download location. This data helps you identify the specific files that are popular or frequently accessed by users.
- Measurement in Events: File download events are included in the overall event measurement framework of GA4. This means you can analyze file downloads alongside other user interactions and events on your website or app, allowing for a holistic understanding of user behavior.
- Conversion Tracking: You can set up conversion tracking for file downloads in GA4. By doing so, you can attribute specific goals or conversions to users downloading files. For example, if downloading a file signifies a successful lead generation or a completed transaction, you can track these conversions within GA4.
Below are the file types currently supported for download.
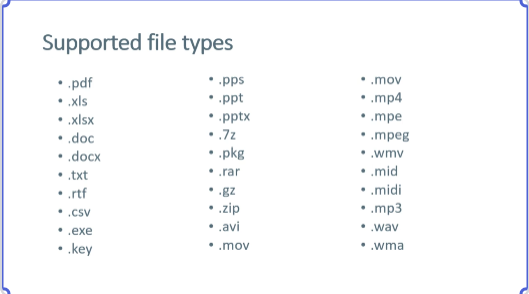
So if you are interested in tracking additional file extensions, you will need to manually configure that with Google Tag Manager.
3. Machine Learning Insights:
GA4 leverages machine learning to provide marketers with automatic insights.
By analyzing large volumes of data, GA4 can uncover meaningful trends, identify key segments, and deliver valuable insights without manual analysis.
These machine-learning insights help marketers to note patterns, predict user actions, and optimize their marketing strategies accordingly.
Focusing on predictive analytics, there are currently 3 predictive metrics available;
- Purchase probability: this is the probability that a user who was active in the last 28 days will log a specific conversion event within the next 7 days.
- Churn probability: the probability that a user who was active on your app or site within the last 7 days will not be active within the next 7days.
- Revenue prediction: the revenue expected from all purchase conversions within the next 28 days from an active user in the last 28 days.
With Predictive analytics;
- You get to analyze customer activity –
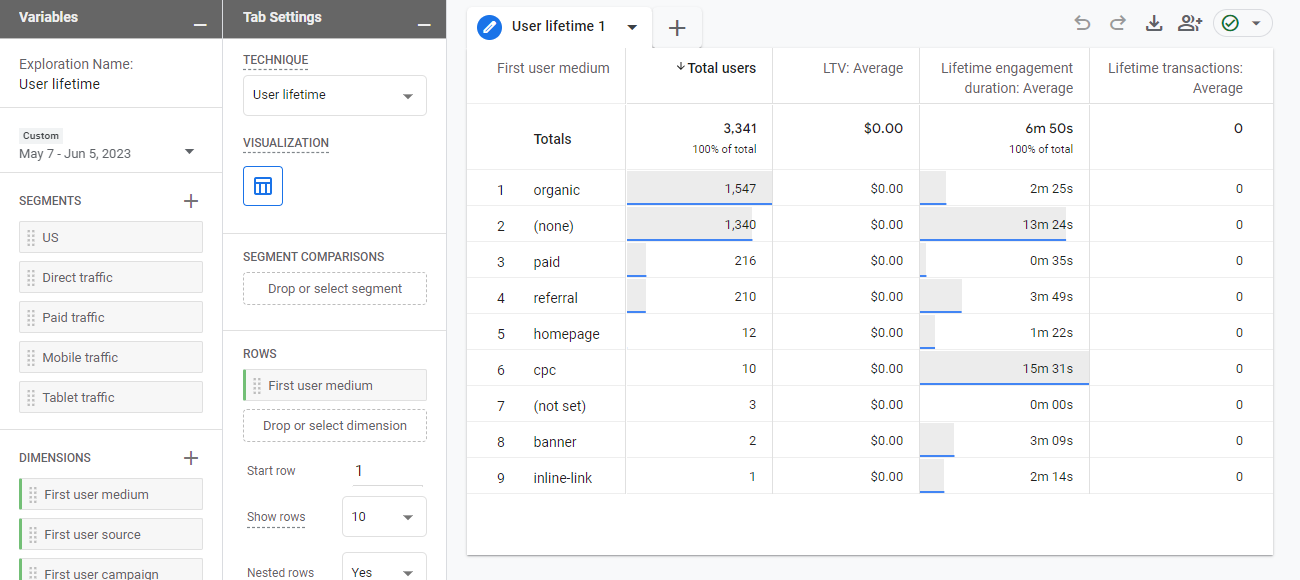
In the Explorer workspace, for example, you can use the user lifetime technique to identify which marketing campaign helped you acquire users with the highest purchase probability. With that information, you might decide to reallocate more of your marketing budget toward that high-potential campaign.
- You can build predictive audiences in Google Ads –
In the past, if you wanted to reach people most likely to purchase, you’d probably build an audience of people who had added products to their shopping carts but didn’t purchase.
However, with this approach, you might miss reaching people who never selected an item but are likely to make a purchase in the future. Predictive audiences automatically determine which customer actions on your app or site might lead to a purchase.
- Trigger events when users match the definition of an audience and become users.
This allows for greater action ability to send conversion events to a linked Google Ads account for bidding purposes.
Here’s how the predictive analytics interface looks like based on the user lifetime template;
4. Simplified Implementation:
GA4 offers a streamlined implementation process with a single tracking code, simplifying the setup and management for marketers.
Unlike the previous versions of Google Analytics, where multiple tracking codes were required for various functionalities, GA4 uses a single code known as the Global site tag.
This unified approach reduces complexity, saves time, and ensures consistent and accurate data collection across websites and apps.
Marketers can easily set up GA4 from scratch or migrate from existing Universal Analytics to leverage the benefits of the new platform.
See this article by Google itself on how to set up GA4 if you have Universal Analytics running on your site.
If your website is new and you don’t have Universal Analytics, and you want to set up GA4 instead, check it out.
5. New Privacy Controls:
Privacy concerns have been growing for a few years now, and GA4 addresses this by offering new privacy controls.
Marketers can disable ad personalization if they want to prioritize user privacy.
Additionally, even within a region where ad personalization is used, GA4 allows marketers to exclude specific events containing private information.
This ensures that sensitive user interactions are not used to generate audiences, providing an extra layer of privacy protection and compliance with regulations.
6. Create and even track up to 300 Events.
This wasn’t possible in Universal Analytics.
In GA4, you can create and track up to 300 different events per property.
This expanded capacity allows for more granular tracking of user interactions, giving you a deeper understanding of how users engage with your content and features.
The benefits of this new feature include the following;
- Customization: You can define events based on specific actions that are relevant to your website or app. This flexibility enables you to track and measure actions that are unique to your business objectives.
- Insightful Analysis: By tracking events, you can analyze user behavior patterns, identify popular features, evaluate conversion funnels, and optimize user experiences. This data helps you make informed decisions to enhance your digital presence.
- Campaign Effectiveness: Events can be tied to marketing campaigns, allowing you to measure the success of different campaigns based on user interactions. This information helps you allocate resources effectively and refine your marketing strategies.
7. Create Custom Reports
With GA4, you can create custom reports. Something that wasn’t available in Universal Analytics.
The fact is, Google Analytics 4 is filled with reports and data you will never look at. On the other hand, there are metrics important to your business that you aren’t seeing.
With Custom reports in GA4, you can eliminate the metrics irrelevant to your business while focusing on the ones that are.
Here are more benefits of the custom reports feature.
- Tailored Insights: Custom reports allow you to design and configure reports specifically tailored to your unique business needs and objectives. You can choose the metrics, dimensions, and visualizations that provide the most valuable insights for your organization.
- Comprehensive Analysis: By combining different dimensions and metrics, you can uncover hidden patterns, correlations, and trends that may not be readily apparent in standard reports. This comprehensive analysis can lead to more informed decision-making.
- Streamlined Reporting: Custom reports provide a streamlined and efficient way to regularly access the specific data you require. You can save and schedule these reports to be automatically generated and delivered to key stakeholders, saving time and effort in manual data extraction and report creation.
- Data Visualization Flexibility: GA4’s custom reports offer flexible data visualization options. You can pick from various chart types, tables, and graphs to present data in a visually appealing and easy-to-understand format. This enhances the communication of insights and facilitates better data-driven discussions within your organization.
- Segmentation and Comparison: Custom reports allow you to segment and compare data based on different criteria, such as user behavior, demographics, or marketing campaigns. This segmentation capability provides deeper insights into the performance of specific segments and helps identify areas for improvement or optimization.
To customize overview reports and reports snapshots, Google support has an in-depth article.
Note: You need editor access to be able to create custom reports.
8. Anomaly Detection
This allows you to add more insights to the graphs and reports you’re looking at.
You can find this under the free-form exploration report.
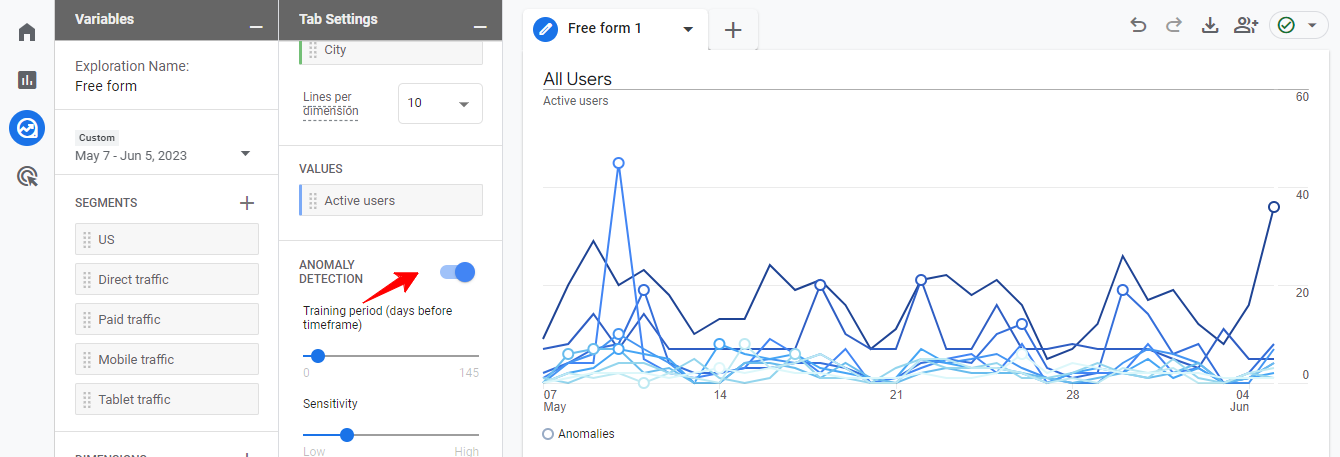
Ensure the anomaly button is toggled on; if not, you won’t be able to use this feature.
Looking at the Line chart above, an anomaly will appear as an open circle, and when you hover over it, it tells you what that anomaly is.
For the sake of this example, I hovered over an anomaly and saw we had a 171.4% increase in active users on May 11.
I added the Session source/medium dimension to investigate further to see where these extra users came from.
This is something you can do for your site. When you detect such an anomaly in traffic, you can dive deep to discover where it’s coming from.
Transitioning to Google Analytics 4
1. Coexistence with Universal Analytics:
It’s important to note that Google Analytics 4 (GA4) is a separate version, not a direct upgrade to Universal Analytics.
This means that businesses can run both versions concurrently during the transition period.
GA4 offers new features and a different data model, while Universal Analytics continues functioning with its existing setup.
Running both versions simultaneously allows businesses to gradually transition to GA4 while maintaining their existing reporting and data collection processes.
During this coexistence phase, businesses can experiment with GA4, explore its capabilities, and gradually migrate their tracking and reporting to the new platform.
This approach ensures a smooth transition without disrupting current operations and allows for a gradual adjustment to the new features and data model of GA4.
2. Data Considerations and Migration:
GA4 uses a different data model from Universal Analytics, which means that the data collected in Universal Analytics will not be directly compatible with GA4.
Therefore, businesses should plan and implement a data migration strategy to seamlessly transfer important data to GA4.
During the migration process, businesses should identify the key metrics, dimensions, and events (that are important to them) and that need to be migrated from Universal Analytics to GA4.
This includes setting up equivalent event tracking and custom dimensions in GA4 to capture the same level of detail as in Universal Analytics.
It is crucial to understand that historical data comparisons between GA4 and Universal Analytics might not be fully compatible due to differences in the data models and tracking methods.
However, by ensuring consistent tracking implementation and setting up cross-platform and cross-device tracking in GA4, businesses can capture and analyze data from the transition period onwards, allowing for future comparisons and analysis.
Furthermore, it’s advisable to maintain access to historical data in Universal Analytics during the transition phase to facilitate any necessary historical comparisons or reporting requirements. This ensures businesses have a reference point for analyzing past performance and trends.
Best Practices for Utilizing Google Analytics 4
1. Setting Up Essential Tracking
To make the most of Google Analytics 4 (GA4), it’s essential to set up proper event tracking. Follow these steps to implement basic event tracking:
Step 1: Identify key user interactions: Determine the specific actions on your website or app that align with your marketing goals, such as form submissions, button clicks, or video plays.
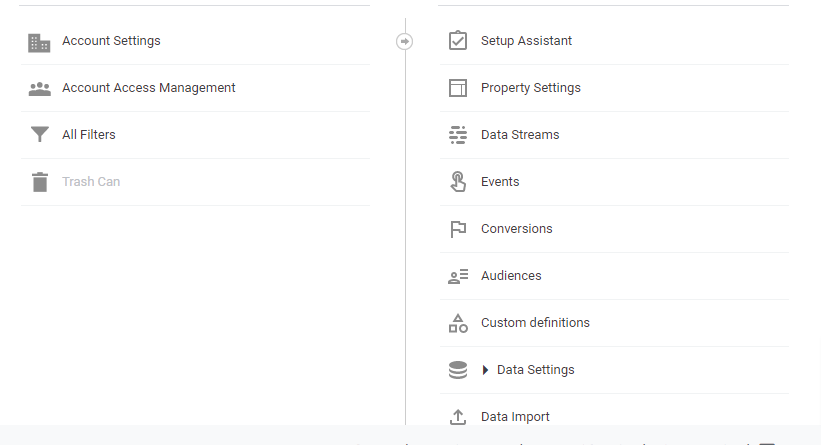
Step 2: Define events: In the GA4 admin interface, navigate to the “Events” section and create custom event names corresponding to the user interactions you identified in Step 1.
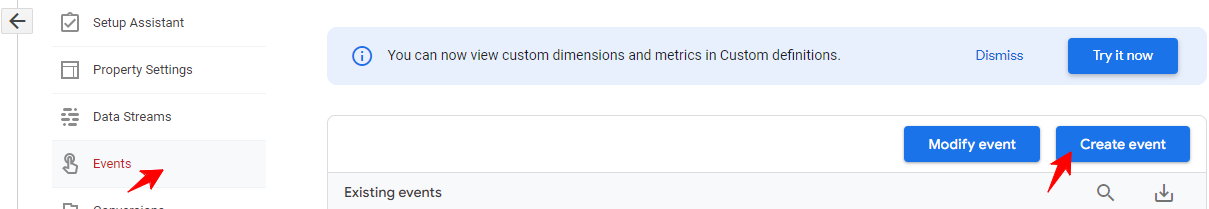
Here’s what the admin interface looks like;
Here’s the option to create a new event based on user interactions important to your business;
Step 3: Implement event tracking: Add the GA4 tracking code to your website or integrate the GA4 SDK into your mobile app. Use the provided documentation or Google Tag Manager to implement an event tracking code for each custom event.
Must Read: How to set up Google Analytics 4 events with Google Tag Manager
Step 4: Test and validate: Ensure that the events are tracked accurately using the Real-time report or the Debug View feature.
2. Customizing Reports and Dashboards
Customizing reports and dashboards allow you to focus on specific metrics and visualize data that aligns with your marketing objectives. Doing this also helps with reporting.
Here are steps to create customized reports and dashboards:
Step 1: Identify key metrics: Determine the specific metrics that are most relevant to your marketing objectives. This could include conversion rates, bounce rates, time on the page, or any other relevant metrics.
Step 2: Create custom reports: In the GA4 interface, navigate to the “Reports” section and select “Custom Reports.” Define the dimensions and metrics you want to include in your report.
Step 3: Configure data visualization: Customize the data visualization by selecting appropriate chart types, filters, and date ranges. This allows you to present the data in a way that is easy to understand and aligns with your reporting requirements.
Step 4: Save and share reports: Save your customized reports for future use and share them with relevant stakeholders to keep them informed about the marketing performance.
3. Leveraging Machine Learning Insights
GA4 incorporates machine learning to provide valuable insights into user behavior patterns and trends.
Here are some tips for leveraging these insights:
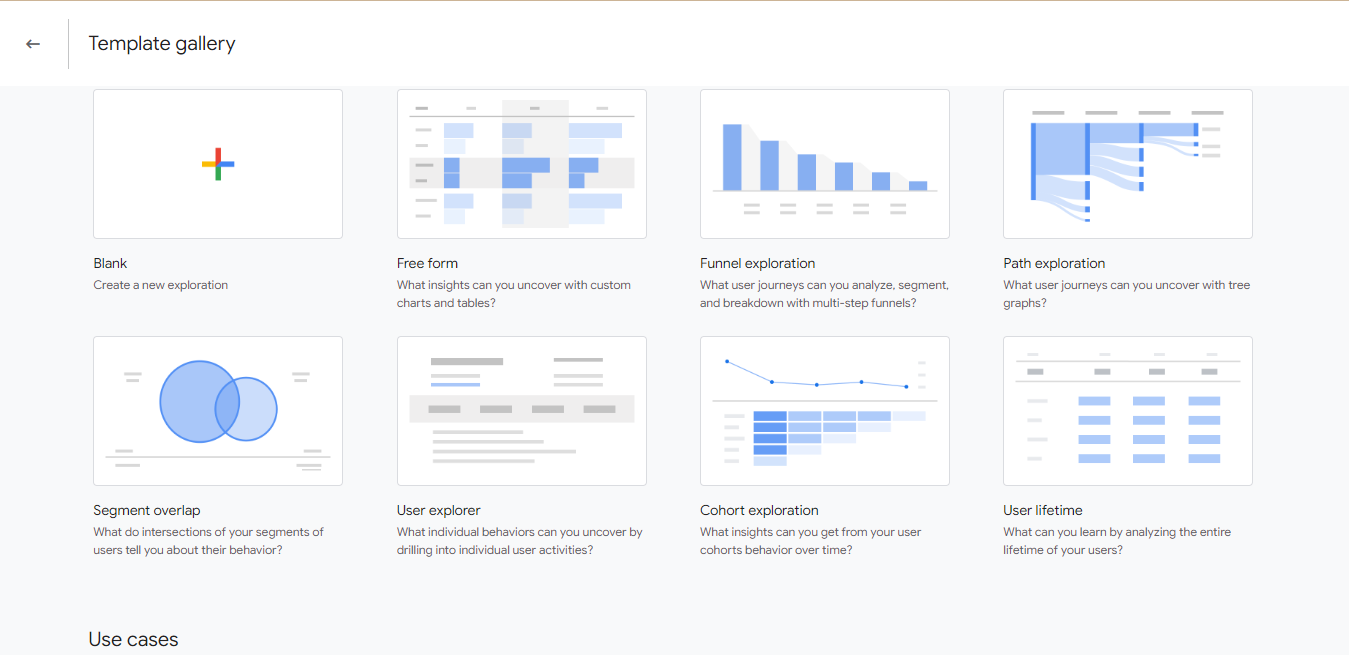
Tip 1: Explore the Exploration feature: GA4 offers a range of pre-built reports and insights. Dive into the “Exploration” feature to analyze user behavior, segmentation, and conversion paths. Utilize several exploration templates to uncover valuable trends and opportunities.
All you need to do is click on the explore function on the GA4 interface, and when it opens up, click on the template gallery, and you have several options to choose from.
Tip 2: Use predictive analytics: Take advantage of GA4’s predictive analytics capabilities to anticipate user behavior and trends. Identify patterns and trends from historical data to optimize your marketing strategies, target high-value segments, and deliver personalized experiences.
Tip 3: Test and refine: Continuously test different strategies and track their impact on user behavior. Utilize GA4’s machine learning insights to identify the most effective approaches and refine your marketing strategies accordingly.
Final Thoughts
It’s true that the time is almost up for the deprecation of Universal Analytics, but the upside is that GA4 hosts some amazing features and capabilities that marketers will find useful.
If you’re yet to start using Google Analytics 4, I’ll suggest you take some time off to create the property on your site and start experimenting.
This way, you’ll have valuable metrics and dimensions set up for your business just in time.


