
Thanks to Google Analytics and amazing data evangelists for popularizing analytics and the use of data in digital marketing!
I recall a conversation I had 12 years ago with Kurt Peters, the editor in chief of the Internet Retailing Magazine, explaining to him how many of the large retailers we were working with back then either did not have analytics installed on their websites and if they did, they did not have a team to analyze the data.
Fast forward to 2017, things have changed quite a bit.
Most companies we talk to nowadays have a dedicated team (or person) looking at analytics.
But now we are facing a new challenge.
We have many analysts who are dedicated to collect and generate data from analytics programs. However, few companies know how to use analytics to derive meaningful business insights and decisions. Sadly enough, the role of an average analyst seems to be limited to simple weekly or monthly reporting.
Sorry, I will be brutally honest in the next couple of paragraphs at the risk of offending some people.
I hear too many consultants say that analytics data tells you about what is going on your website, but it doesn’t tell you why it is happening.
Consultants who make such statements are most likely new to the field of data management and data optimization. This problem is compounded due to very little formal college education to help new graduates and those seeking a career in analytics.
Analytics not only tells you what is problems you have on your website; it will also tell you what changes you need to make to fix these problems.
You just have to examine and analyze the data carefully.
Many analytics consultants are able to examine data and identify a particular problem in visitor behavior. They do not do a good job explaining why a particular problem is happening, the impact of that problem on the website, and the potential revenue gain by fixing that problem.
An expert analytics or conversions optimization consultant should be able to:
- Collect the data
- Generate the required custom reports
- Use data to explain why a certain behavior is taking place (why things are happening in a certain way)
- Use data to explain why a certain behavior is taking place (why things are happening in a certain way)
- Recommend changes to the website to deal with a particular visitor behavior
- Explain the financial impact of any suggestion he makes
In the following chapters, we will focus on how Google Analytics can contribute to your CRO process. We focus mainly on Google Analytics since 90% of the companies we talk to regularly use it as their main analytics tool.
How To Set Up Conversion Rate Goals In Google Analytics

Standard content reports generated by Google analytics describe metrics/performance of a single page. These reports are useful at an introductory and general level. You will have to create many custom reports, goals, and funnels to be able to track visitors’ behavior around your website.
Conversion Rate Goals help you measure the visitor flow from one page of your website to the next.
You can measure the percentage of website visitors that navigate from your homepage to services pages for a SaaS company. For an e-commerce website, you can track visitors moving from category pages to product pages and so on.
Creating goals in Google Analytics
To create your first GA goal, login to your Google account.
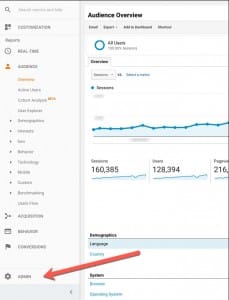
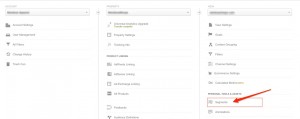
Click on the “Admin” in the left navigation which will take you to the administration panel for your Google Analytics account.
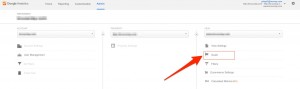
On the admin panel of your Google Analytics account, click on “Goals” in the View column.
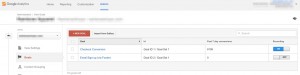
The goals page lists all the different goals you already have set up for your account.
If it happens that you do not have the “New Goal” button on the Goals page, you do not have the required permission. To see the “New Goal” button you should have “Edit” permission at the account level.
If you have the right privileges, then you will see the “New Goal” button.
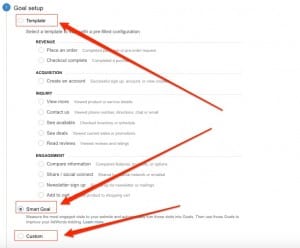
Google analytics offers three different top-level goal categories:
- Template-based goal
- Smart goal
- Custom goals
These different top-level categorizations of goals boils down into 5 different goals types which Google analytics supports:
- Destination: These GA goals are measured by website users visiting a web page. Examples of destination goals could be order confirmation or a “thank you” page from a contact form.
- Duration: These Google Analytics goals are measured by the visitor spending more than a certain time. For example, you might be interested in tracking visitors that spend more than 30 seconds on your website.
- Pages/Screens per session: These GA goals are measured for visits that have more than a certain number of pages per session. For example, you might be interested in tracking visitors that visit more than 3 pages of your website in a session.
- Event: These goals measure different events tracked in Google analytics based on the event category, action, label, or value.
- Smart Goals: these goals use machine learning to analyze different signals about your website visits to determine which of those are most likely to result in a conversion. Smart goals are popular for AdWords conversions. While there might be some benefit of using smart goals, they are a lazy way out. Do not expect Google to do the heavy lifting on your behalf!
Shortcomings of GA goals

There are a few shortcomings of Google analytics goals that you should be aware of:
- If you create it, you cannot delete it: As you create different goals in Google Analytics, you will eventually find out that if you create a goal, there is no way to delete it. Your options will be to either:
- Remove/delete its different steps and rename the goal to something so that you signal to yourself and other team members that the goal is not a valid one.
- Change the name and the steps with another goal (make sure to annotate your GA account when you made the switch), let it live, and remember that you are not paying for GA.
- Initial data collection takes 24 hours: After setting up the goals, it takes up to 24 hours for initial data collection and for the goals to be populated. This becomes an issue for many beginners because many set up the goals and wait for 24 hours to discover that they had a mistake in a particular step. That is the reason you should pay close attention to every URL you are including in the goal setup.
- They are not real-time: goal data is not real-life data which is typical to other data forms from Google.
- No segmentation: We love segmentation and GA did an amazing job adding both standard and custom segments. The only problem is that there is no way to apply these segments on top of GA goals. This is a huge drawback. There is no workaround to this except creating different Google analytics views to represent the segments you want to track and re-create the goals in them. This seems like a lot of work and data duplication but as of now, this is the only way open available.
After you set up the initial goals in GA, there are two ways to view them:
- Funnel visualization report
- Goal flow report
Funnel visualization report in Google analytics
Many marketers like to use funnel visualization reports since it provides with a nice visualization of the visitor flow through the website funnels.
There are a couple of other points that are important to understand if you start using the funnel visualization report.
1. Google Goal Backfilling
According to Google Analytics support:
The Funnel Visualization report backfills any skipped steps between the step at which the user entered the funnel and the step at which the user exited the funnel.
Thus, this makes the report not quite accurate.
2. Order of Funnel Steps
There is another peculiarity of this report that you should be definitely aware of.
“The actual order in which the steps were viewed isn’t represented in the Funnel Visualization report. Analytics scans through each session, checks if a certain step is viewed, and then increments that step by 1 in the Funnel Visualization report.”
The support document gives the following example:
“For example, let’s say your funnel is defined as /step1 > /step2 > /step3.html > goal.html. A user then had this session: /xyz > /step3 > /step2 > /abc. The Funnel Visualization report would show an entrance from /xyz to /step2, a continuation to /step3, and an exit from /step3 to /abc.”, according to Google Analytics support.
3. Required step
When setting up goals, Google allows you to select a checkbox, if the first step is required or not.
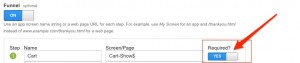
It is important to understand that “the required first step applies only to the Funnel Visualization report. When you check that the first step as required, the Funnel Visualization report only includes goal conversions that pass through that required step”.
While the funnel visualization report is excellent in theory, the backfill and the order of funnel steps features make this report inaccurate and not very reliable in most cases.
What is the best way to deal with google analytics backfill and order of steps issues in funnel visualization report?
There are two ways to deal with this issue:
Use the goal flow report
If you create goals in Google Analytics then use the goal flow report since it avoids both of these issues.
According to Google support:
“The Goal Flow report does not backfill steps. You will see flows from the originating dimension to the first step in the funnel that the user saw. You may see flows that skip a step altogether.”
The goal flow report also maintains the same order in which visitors went through going through the funnel.
As an added HUGE bonus, the goal flow report allows for advanced segmentation and allows you to compare data from different dates.
Setup “two steps” goals in GA
These types of goals will have two steps: the starting point and the endpoint. So, there are no steps in between (no middle pages). This might be limiting but it does avoid the issues of backfilling and visitor order mentioned above.
For further reading on the difference between the Funnel Visualization and Goal Flow reports, we highly recommend reviewing the Google Analytics help page here.
Google Analytics Goals as We Like Them for Ecommerce Websites
Humans are not linear when they navigate around a website. We jump from one page to the next. We go back and forth.
While there is good value from single-page reports, increasing a website conversion rate requires us to set up and analyze many goals around the website.
In order for the visitor to convert on your website, he will go through many steps. It is critical to set up different goals to track visitor navigation through these mini funnels.
Here are some of the funnels we usually set up for e-commerce websites:
- Homepage to Category pages: this is a goal that tracks the navigation from your homepage to the different category pages on the website.
- Category pages flow-through rate (to product page): this is a goal that tracks the navigation from the different category pages to the product pages on the website.
- Search to product: this is a goal that tracks the navigation from the search results pages to the product pages.
- Search to conversions: this is a goal that tracks the navigation from the search results pages to the conversion pages.
- Pre-product page abandonment rate: This goal tracks the number of website visitors that land on your website but never makes it to your product pages. If you have enhanced ecommerce implemented on your website, you can see this metric reported without having to set up a goal.
- Product to category page flow back: this is a goal from product pages back to category pages.
- Product page effectiveness rate: this is a goal that tracks clicks on the add to cart button from product pages.
- Product page to cart page flow rate: if your ecommerce implementation does not take visitors to the cart page after the visitor clicks on the add to cart page, then this goal tracks the visitors’ movement from product pages to the cart page.
- Cart to order confirmation: this is the goal starting with the cart page to order confirmation. This goal will allow calculating your cart abandonment rate.
- Checkout completion: this is the goal starting with the first step of the check to order confirmation. This goal will allow calculating your checkout abandonment rate.
Please note that these are the 10 minimum goals that you should track on your e-commerce website.
Google Analytics Goals for SaaS and Lead Generation Websites
Most SaaS and lead generation websites are less complex compared to ecommerce websites. And while you deal with different classes of pages when it comes to ecommerce websites, this mostly not the case with SaaS and lead-gen websites.
Google Analytics goals you should create for a SaaS or lead generation website:
- Lead magnets: if you have a blog and offer some freebies to download, set up goals for people who download them using either event or “thank you” page.
- Email subscription: set up goals for email subscription pages. Later in the goal report, you will be able to check which page brings more email subscriptions.
- Trial requests: a simple goal that will track how many people clicked the “Trial” button, if you have one.
- Inquiry submission: if you have any inquiry forms (contact forms), set up goals for them as well.
- Sign up: last but not the least, don’t forget to set up a goal for the signup button (as even) or “thank you” page.
Data Segmentation Mantra

Analytics data without segmentation is useless. At a minimum, you need to be looking at two main segments based on the device type: desktop (and tablet) vs. mobile visitors.
If your site gets enough traffic, then you should expand into the following 4 segments:
- Mobile new visitors
- Mobile returning visitors
- Desktop new visitors
- Desktop returning visitors
Further, as you dig deep into analyzing data, you should analyze the behavior of visitors for each segment based on the traffic source and medium.
How do you create segments in Google analytics?
Out of the box, Google Analytics provides a list of segments that you can use right away. We like to add a few more segments for data analysis. To create new custom segments, follow these steps:
1. To create custom segments, navigate to the admin side of your Google Analytics account.
2. Click on segments under the view
If you have “Edit” permission for your GA account, you will see the “New Segment” button:
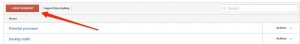
This will take to the screen which you can use to create new segments.
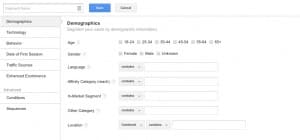
Here are some of the segments that you should definitely create:
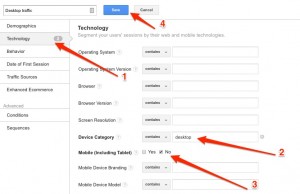
Desktop visitors segment
For some reason, GA decided to combine desktop visitors with tablet visitors. We like to see the behavior of desktop visitors separately. To create a segment for desktop visitors, you will need to do the following:
1. Click on technology sidebar
2. Under the device category, select “Contains” from the dropdown and desktop in the text box
3. Select “No” for Mobile (including tablet)
4. Click on save
Potential purchasers segment (ecommerce)
This is a segment for the visitors how who click on the add to cart button but never place an order. Setup for this segment will depend on your e-commerce implementation.
To set up this segment:
1. Click on “Conditions” under “Advanced” in the sidebar
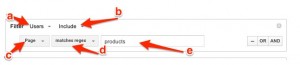
2. Create a filter for visitors who visit product pages:
3. Select a filter for “Users” from the dropdown
- Select “Include” from the dropdown to include visitors in this segment.
- Select “Page” from the first dropdown
- If you have reg-ex for your product pages, then select “Matches Regex”
- include the regular expression for your product pages.
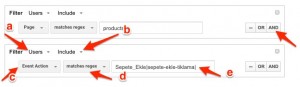
4. Click on “AND” to Add another filter for visitors who click on the add to cart button:
- Select a filter for “Users” from the dropdown
- Select “Include” from the dropdown to include visitors in this segment.
- If you are triggering an event when a visitor clicks on add to cart button, then select “Event Action” from the dropdown
- Select “Matches Regex”
- Include the regular expression for the add to cart event
 5. Click on “AND” to Add another filter for visitors who did not complete the purchase:
- Select a filter for “Users” from the dropdown
- Select “Exclude” from the drop to exclude visitors who placed an order.
- Select “Page” from the first dropdown
- If you have reg-ex for your order confirmation page, then select “Matches Regex”
- Input the regular expression for your product pages. If you only have a single order confirmation page with a unique URL, you can select “Exactly Matches” and include the URL of the confirmation page.
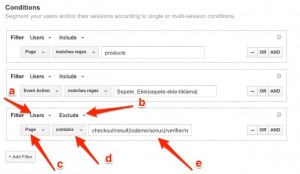 6. Click on “Save”
Potential Subscribers Segments (SaaS)
To set up this segment:
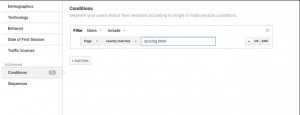
1. Click on “Conditions” under advanced in the sidebar.
2. Create a filter for visitors who visit product pages:
- Select a filter for “Users” from the dropdown.
- Select “Include” from the dropdown to include visitors in this segment.
- Select “Page” from the first dropdown.
- If you only have one URL to your pricing page, then select “Exactly Matches” from the dropdown (If you have reg-ex for your pricing page, then select “Matches Regex”)
- Add the URL of your pricing page
- Select a filter for “Users” from the dropdown.
- Select “Include” from the dropdown to include visitors in this segment.
- If you are triggering an event when a visitor clicks on the “select the plan” button, then select “Event Action” from the dropdown.
- Select “Matches Regex”.
- Include the regular expression for the “Subscribe” event.
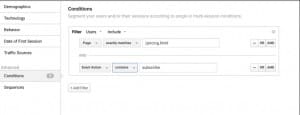
4. Click on “AND” to add another filter for visitors who did not subscribe:
- Select a filter for “Users” from the dropdown.
- Select “Exclude” from the dropdown to exclude visitors who subscribed.
- Select “Page” from the first dropdown.
- If you only have a single order confirmation page with a unique URL, you can select “Exactly Matches” and include the URL of the confirmation page.
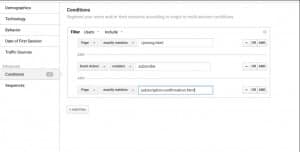 5. Click on “Save”.
Data Sampling in Google Analytics

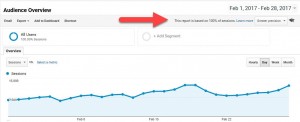
To decrease loading latency, Google Analytics employs data sampling when the number of sessions exceeds 500k in the selected date range (GA basic plan).
Ad-hoc queries of your data are subject to the following general thresholds for sampling:
Analytics Standard: 500k sessions at the property level for the date range you are using
Analytics 360: 100M sessions at the view level for the date range you are using
Note that default reports are not subject to sampling. Only custom (ad-hoc) reports are, and this is indicated at the top of the page in Google Analytics.
So, what does this mean from a conversion perspective?
Data sampling is a valid statistical method, but it increases the range of error in your data. Meaning when you look at sampled data, always keep in mind that the level of accuracy is not at 100%, and actual numbers may vary slightly.
One simple way around this is to change the date range to a smaller period of time. This will reduce the number of sessions to the extent that Google Analytics would not sample the data.
You can also check out those 8 Ways to Get More Data from Analytics.
Don’t Forget to Send Your AB Testing Data to Google Analytics
Always send your AB testing data to Google Analytics. Even if the software you are using reports data, another tool can’t do harm.
Now keep in mind the data itself may vary from one tool to another (either because of sampling or the method for collecting the data), but Google Analytics gives you more insights than other tools, since it is probably already integrated on your website across all the URLs and events.
This helps you most when you want to start segmenting visitors for each test variation. This can give you endless insights on which variation worked best for:
- New vs. returning
- Source type
- Logged vs. not
- Technology
- Geographical regions
- Gender
- Age range
- Content viewed*
- Action taken
For example, sending your data to Google Analytics enables you to measure which variation did better for visitors who viewed a certain set of content on your website (a blog post or an FAQ page). And the same concept goes for the other segments you can apply.
So, for each test you run, always keep 3 questions in mind:
- Does a particular variation perform better for a specific segment? If yes, then:
- Did we capture enough data to make the assertion? Because having a high level of confidence in the results is mandatory for making a decision
- Does the ROI justify the cost of personalization? And this can be learned by measure the average order value (AOV) for each winning variation/segment
Why I Hate Bounce Rates?
It is difficult to listen to or watch a presentation about analytics/SEO/CRO without hearing the speaker mention pages with high bounce rates are pages optimal for conversion optimization.
The term bounce rate was first coined by Avinash Kuashik back in 2006.
The bounce rate is the percentage of visitors that land on your website and leave without ever visiting a second page.
The bounce rate measures the ability of a single page of your website to persuade visitors to stay on the website. In that sense, bounce rates can be very powerful. However, in our search for “easy” ways to optimize a website, bounce rates were misused in situations where they are not a good fit.
Analytics measures users’ behavior on a website. Thus, using data from analytics without thinking of visitor intent will result in bad conclusions.
When to use bounce rates?
The bounce rate is an excellent metric if you would like to measure the effectiveness of a landing page you created for a campaign. It tells you if that landing page is providing the appropriate amount of information for visitors to stay on the website.
Bounce rates can also be a good indicator if you have an e-commerce website. But in this case, you want to look at three different types of bounce rates:
- The bounce rate for your top landing pages
- Bounce rate all across your category pages
- Bounce rate all across your product pages
When should you ignore your bounce rate?
If you are running a content website, then bounce rates might mean very little for you.
Remember, we are trying to understand visitors’ intent. Most people see a link in social media, an email, or in blog, then click on it, read the article and then leave the website right away.
A friend of mine that publishes very unique and well-researched content was complaining to me that his bounce rate on some of these articles was close to 90%. Mind you that his team sometimes spends months researching the content.
“What is wrong with our content?”, he asked.
Nothing was wrong with his content.
People were landing on the article from an email campaign. They read the article. And then they left. They did exactly what most of us will do.
We can, of course, get into the nitty-gritty of what actions visitors could take (subscribe, share, etc) but let’s focus on the big picture.
Thoughts on Exit Rates
Exit rates measure the percentage of your website visitors, who visited another page and then decide to leave the website at this particular page.
At some point, every visitor to your website will exit.
The bigger problem with bounce and exit rates is that they measure the behavior of visitors on a single page.
But our decision as humans to leave the website is the result of navigating around the whole website. It is not always sensible. Sometimes it is just a shot in the dark that changes everything.
That is the reason, I find that setting up funnels and goals a lot more effective and powerful.
Over to You
Conducting conversion optimization requires you to spend your time equally divided between analyzing analytics data, analyzing qualitative research data, coming with new designs, and testing which design increased conversions.


