
Evaluating the revenue impact of your experimentation program is crucial for making informed business decisions.
But the truth is many businesses don’t know how to forecast revenue or do revenue attribution for their testing program.
You can measure the success of your experimentation program by measuring its total revenue impact over time. This approach helps you identify the most successful experiments, which could lead to more investment in similar opportunities.
You may also want to look at how much revenue multiple experiments contributed directly (versus other factors like cost savings). This can help you decide whether or not to invest more in a particular area where you’ve seen some success – or if it might be better spent elsewhere.
Measuring the revenue impact of your testing program is one of the most important things you can do to make data-driven decisions.
After all – you wouldn’t want to launch a slow-selling product on Amazon or your own ecommerce site just because it was optimized for search rankings…right? Unfortunately, this is all too common among sellers.
But don’t worry! Here’s what you should know about measuring the revenue impact of experimentation:
Why is Measuring the Revenue Impact of Experimentation Important
The revenue impact of experimentation is an important metric to track. And it’s not a secondary metric either; it’s one of the primary determining factors. It can help you understand how much money you’re making from experiments and what’s working.
If you don’t measure the revenue impact of experimentation, you won’t know if your efforts are paying off. Without this information, you’ll be flying blind when it comes to improving your business.
For example, if a marketing campaign increased sales but decreased profits, then a measurement of just sales would show that it was a successful initiative. However, if we also measured earnings before and after the campaign took place (and reduced them), we would know that this campaign wasn’t worthwhile.
The revenue impact of experimentation helps businesses:
- Understand which experiments are working.
- Determine which users are converting on their first visit or purchase.
- Identify which pages or features are driving the most revenue.
The bottom line is: If you’re not tracking experiment revenue, then you won’t know if they’re worth continuing.
This is why measuring the revenue impact of experimentation is so important. If you know how much revenue an experiment generates, then it can be easier to justify investing more time and resources into it.
Of course, measuring experiment revenue isn’t always easy — especially when multiple tests are running. But by taking some simple steps and using a few tools at your disposal, you’ll be able to track experiment performance quickly and easily.
The good news is that you don’t have to be an expert in statistics or data analytics to measure the revenue impact of your experiments. You just need to know what data to collect and how to interpret it.
Ways to measure the revenue impact of experimentation
1. Set a conversion goal for your experiment.
Experimenting with your website is a great way to improve conversion rates. But how do you differentiate a winning experiment from a losing one?
The answer lies in setting a conversion goal for each experiment. This is an easy but often overlooked step.
What is a conversion goal?
A conversion goal is an action that leads to a desired result. In marketing terms, this might be a sale or lead generated from an online ad campaign. In e-commerce, it might be a purchase made on your site.
For example, let’s say you’re running an ad campaign for your new product line and want to increase sales of the product by 10% over the next month. You could set up an A/B test to test two different landing pages and optimize for whichever performs better when it comes to achieving this goal (more sales and revenue uplift).
Or, if you’re testing a landing page design, you might set a conversion goal of 5% more sales from the new version over the old one.
For example, if you make $1 million per month and have 1 billion impressions per month across all pages on your website, then 5% more conversions would give you $50k in additional revenue per month — which is significant!
Pro Tip: Once you have your outline, create goals using a tool like Taplytics. It will let you take complete control of your releases. You can also instantly test and roll out new features with its advanced feature management and experimentation features.
2. Measure direct revenue
Direct revenue includes revenue from sales, fees, and charges directly associated with a product or service. Indirect revenue includes all other sources of revenue that are not directly associated with any specific product or service.
The reason direct revenue is so important when measuring the impact of experimentation is that it gives you a sense of how much money your business would have made if you had not experimented. In other words, it lets you know how much incremental value you created by testing one thing versus another.
It also gives you a baseline for comparison, which is important because it allows you to determine whether or not your experiment worked.
For example, let’s say that you run an online store selling T-shirts.
You run an experiment that changes the price of your most popular design from $15 per shirt to $17 per shirt. You track the number of shirts sold each week before and after the experiment, along with how much money each sale generated.
At the end of two months, you notice that sales have increased by 10% – but how do you know that your experiment caused this increase? You can compare it against other factors like seasonality (maybe summer is busier than winter) or other external factors (maybe there was an ad campaign in that period).
If you don’t account for those external factors, then it’s impossible to know whether your experiment worked or not!
You can further break it down to revenue per visitor. RPV can be calculated by dividing the total revenue you gained during a fixed time period by the total number of visitors during the same period.
For instance, if you have earned $10,000 in revenue in the month of December and your site gets 2,000 visitors, your revenue per visitor would be $10,000/2,000 or $5 per visitor.
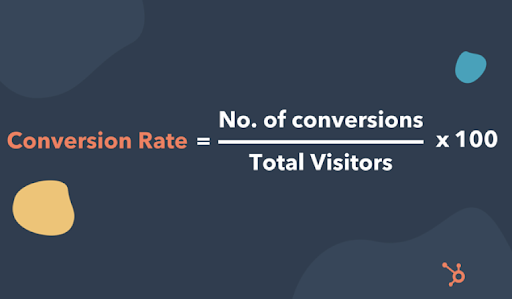
3. Measure the conversion rate.
Conversion rate is a measure of how often visitors to your site take the action you want them to. For example, if your site’s goal is to sell something, your conversion rate would be the percentage of visitors who buy something.
Or for example, if your website has 100 visitors and 10 of them make a purchase, you have a 10 percent conversion rate.
Conversion rates are important for two reasons:
They help you understand the effectiveness of your marketing efforts, enabling you to create a more effective sales funnel.
They tell you whether or not you should be running an experiment on a particular website page or element (such as a call-to-action button). If a change increases your conversion rate but doesn’t affect revenue, then it’s not worth making that change.
There are many ways to measure your conversion rate:
For example, if you want to measure how users interact with a mobile app or website, use Google Analytics (GA) event tracking to track when users perform an action that matters to your business (such as completing a purchase).
You can also measure the revenue impact of experimentation by setting up goals in GA and tracking them as they occur across experiments.
You can also divide the number of conversions by the number of visitors and multiply that number by 100 to get a percentage.
You can use tools like AdWords, Heatmaps, and Session replay tools to track conversion rates.
4. Determine customer lifetime value.
When you’re experimenting, you need to measure the impact on the bottom line. That’s why the customer lifetime value (CLV) metric is so important.
CLV represents the revenue that a customer will generate over their lifetime. It’s an estimate of how much a company can expect to make from a customer over time.
The formula for calculating CLV is simple:
Customer lifetime value = average order value x average number of purchases per year x average customer lifespan in years.
You can further use cohort analysis to attribute the impact the implemented changes had on your CLV and retention.

(Source)
For the uninitiated, cohort analysis is a statistical method used to study groups of people who share common traits. In the case of SaaS companies, a cohort is a group of customers who signed up at a similar point in time and have been tracked over time.
You’ll also want to take a look at cohorts at different points in time to see how they’re performing relative to each other.
For example, if you want to see how different cohorts are performing after six months, you might break down your customers into three groups: those who signed up six months ago, those who signed up one year ago, and those who signed up two years ago.
The goal is that each group should have similar characteristics — say all from the same country or industry — so that any differences in performance can be attributed specifically to the difference in time since they joined the service rather than anything else about them.
Here’s how it works in practice:
Cohort analysis compares two groups of users based on when they first used your product or service. The first cohort was acquired before you implemented your experiment, while the second cohort was acquired after you implemented your experiment.
For example:
The first cohort might be all users who signed up for a new account between January and June, while the second cohort would be all users who signed up between July and December.
You can then compare both cohorts’ retention rates over time to see if there was an impact from your experiment.
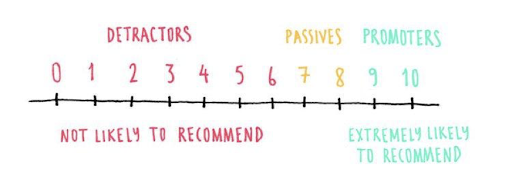
5. Leverage Net Promoter Score (NPS)
Net promoter score (NPS) provides valuable insights into user behaviors by determining how likely customers are to recommend your company to others.
It’s based on the principle that customers respond to one of three reasons and a response scale:
- Promoters (score of 9 or 10): It means that customers are extremely likely to recommend your business to others. These people are your best advocates, and they are the ones who will promote you on social media and other channels.
- Passives (score 7-8): those who don’t hate your product but don’t love it either. They will stay with you if there are no other options available to them.
- Detractors (0-6): It means they’re unlikely to recommend it — or even actively discourage others from buying or using it.
(Source)
In other words, NPS is a great way to gauge how satisfied customers are with your product or service. It can also reveal how well you’re doing at improving their satisfaction over time and whether you’re delivering on your promises.
The more promoters you have, the better your NPS will be. But here’s where it gets interesting: If you can figure out how much more money promoters generate than detractors, then you can use this information as a proxy for how much revenue your business might generate from experimentation.
The NPS can help you measure the revenue impact of experimentation in several ways:
- To quantify the value and direct impact of new features or products you’re going to launch. If you have an existing product and want to know if a new feature will make it more attractive, you can use NPS to quantify the potential revenue increase or decrease from adding or removing features.
- To measure churn rates before and after experiments. You can compare churn rates for customers who were exposed to a certain experiment with those who weren’t exposed, then multiply that difference by the revenue impact of each experimenter group to get an estimate of its effect on your bottom line.
- To measure user behavior, like customer satisfaction with new features or products already launched into production. You can compare customer satisfaction for people who were exposed to a certain feature versus those who weren’t exposed.
The Bottom Line!
For marketers, experiments are a key component to success. Without them, developing new and innovative ideas for customers would be impossible, but measuring the effects of your decisions is also essential.
Revenue gain is one of the key metrics for any business because it directly affects the bottom line. You can’t measure success without knowing where the money comes from.
With that said, there is no single success metric (both primary and secondary metrics) for measuring revenue impact. It depends on what stage your company is in and what type of product or service you offer.
For example, a large ecommerce company may use CPA as one of its success metrics because they have so much traffic and data available to them. On the other hand, a small startup might measure revenue as its primary metric because they have no other options available at this stage of its business development.
The type of product or service you sell will also play a role in determining which metrics you should focus on when measuring revenue impact. For example, if you sell software as a service (SaaS), it’s important to track customer churn rates because these customers generate recurring revenue over time.
When you run multiple tests or are constantly running experiments, the last thing you want to do is lose track of the revenue effects and mess up your numbers.
With this article, we hope you can have an easier time measuring and identifying the revenue impact of your experimentation process.


