
Every week new websites are launched, new features are set to live on applications, and marketers send out their newsletters. It’s only natural to want to know how visitors interact with this content, where they’re clicking, what they’re not clicking on, e.t.c.
Enter click tracking.
As the name suggests, it’s all about tracking user clicks, but it’s deeper than that because click tracking lets you see:
– user behavior on your website,
– how users perceive your content,
– the changes you need to make to improve user experience.
In this article, we’ll be looking at click tracking, how click tracking works, common click tracking tools you should know, benefits of click tracking, how iOS changes affect click tracking in email marketing, and how to set up click tracking using Figpii.
Excited to learn something new? Let’s get started.
What Is Click Tracking?
Click tracking, also known as click maps, is an analytics system used by marketers to analyze where users click on a website, ads, content, and emails and how long they spend interacting with the content.
Clicks are recorded as events or actions.
Every time a web visitor clicks onto a webpage, the click tracking features record the event; as the web visitor continues to browse around the website or app, the user session is logged for further analysis and insight into user behavior.
The real value of tracking user clicks on your website, landing page, or apps is the insight you can gather and use to improve your product, which affects your user experience.
Importance of Click tracking.
More than setting a website to live or launching a new application, click tracking helps you as the marketer or business owner see how your site visitors interact with your website.
Below are some of the importance of having click tracking software installed on your site.
1. It helps you track the effectiveness of your marketing efforts.
2. It gives you insight into the elements that have the most customer interaction and most minor customer interaction. This helps you with A/B test ideas to improve the user experience on your website.
3. The data gotten from user clicks helps you make informed product decisions on how to improve your website or landing page that will drive conversions.
4. Click tracking helps you know what interests users on your site. This enables you to optimize your website for maximum engagement and conversions.
5. It helps to optimize your marketing strategy. The data you gather from observing user behavior enables you to improve your marketing strategy to turn more leads into paying customers.
6. It helps you see user behavior on a granular level. A significant advantage of click tracking is it removes assumptions about how users behave; you see for yourself how they’re interacting with your website.
7. It shows you what users find helpful that could be turned into links. Click tracking software like Figpii has session recording sessions that show you what users are clicking on your website. Some users click on the text, assuming it’s a link. When you see multiple instances, it could give you ideas to put a call to action button there and see how it affects your conversions.
8. It helps you track down what’s broken. Using heatmaps, you can track all the failed clicks that stop your users from moving down the next stage in your marketing funnel and turning them into customers.
9. It helps with improving conversions (and revenue). If you intend to run A/B tests, your insights from heatmaps on user interaction can give you new test ideas.
Where To Use Click Tracking.
If you’re yet to figure it out, click tracking is not only used in websites, mobile apps, and landing pages for analytics, but you can use click tracking in emails and social media ads.
Link Tracking For Marketing Campaigns:
Marketing campaigns on social media platforms such as Facebook, LinkedIn, Instagram, and PPC can be used for brand awareness, lead generation, sales, etc.
When a marketing campaign is successful(leads are generated, sales are made), a savvy marketer will want to find out how he got those sales and what traffic source brought in the numbers.
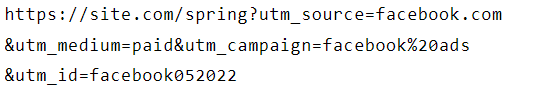
Enter Urchin Tracking Module (UTM) tracking code.
This is one of the most popular ways to track and correctly attribute details to marketing campaigns, and it makes use of UTM parameters.
UTM parameters are query strings added to URLs. They help identify things like traffic source, medium, or campaign name.
Link tracking can help you attribute traffic, sales, and leads generated to different marketing campaigns, which improves your segmentation. Link tracking can also help you track custom campaigns in web analytic tools like Google Analytics.
Here’s an example from lovesdata on how to build a paid Facebook ad campaign using the Google Analytics URL builder:
1.
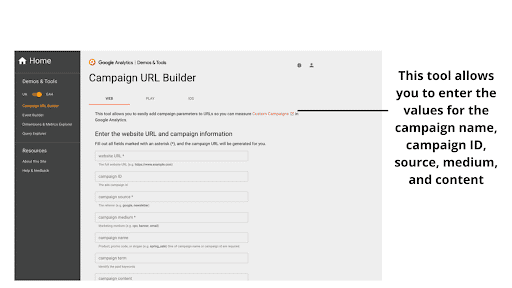
2.
3. Then the campaign URL builder generates a UTM link for you.
Email Link Tracking:
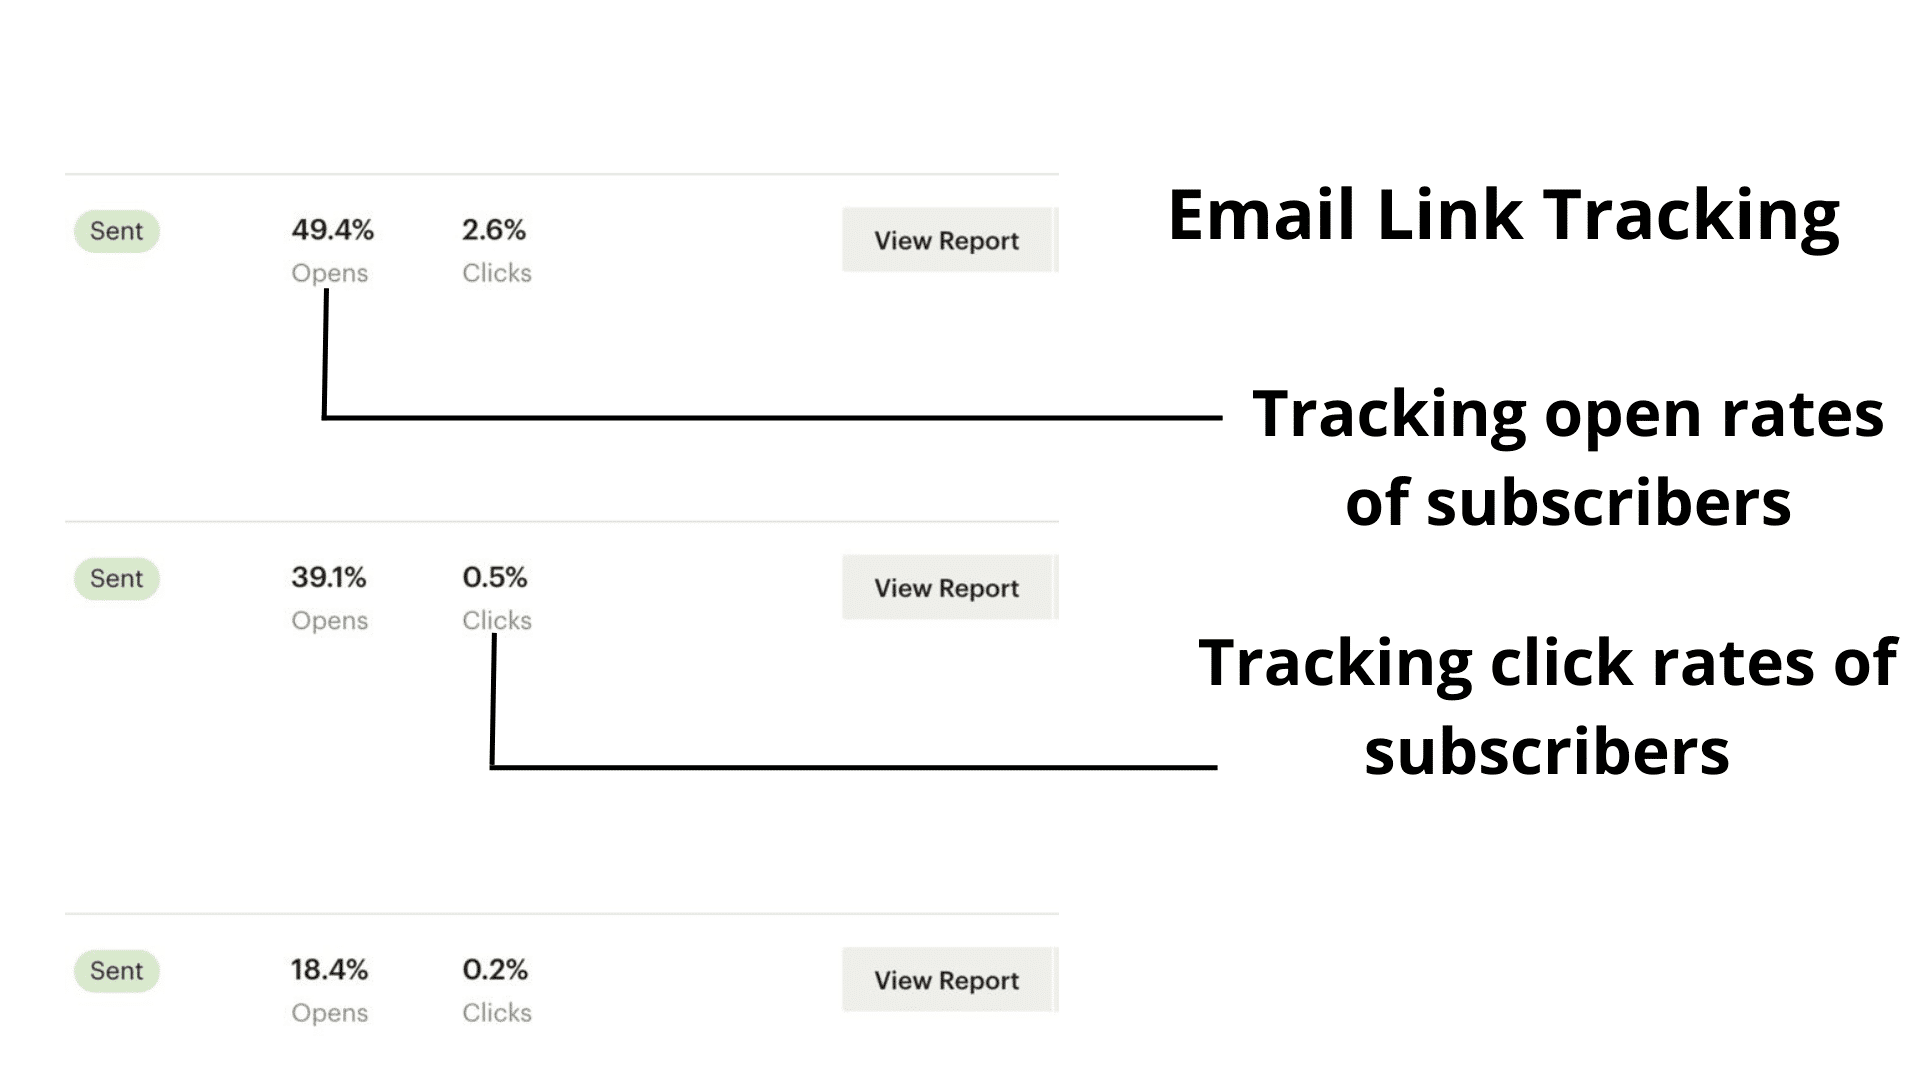
Many popular email marketing tools embed tracking pixels in email messages, which allow marketers to see who has opened, who has clicked through, which subscriber is active on-site, etc.
This is quite powerful because as a marketer, using this feature available to you, you can learn the kind of content your subscribers prefer (text or design-heavy), the time that works best in sending emails, and the subject line format that works, etc.
Here’s an example from Mailchimp, the ESP we use to keep in touch with our subscribers.
P.s: last year, Apple made some changes to its operating system, thereby impacting the ability of email marketers to track clicks accurately (more on this in its section).
UX Click Tracking:
Moving on from link tracking, it’s possible to have a visual representation of everything your web visitor does on your website.
Heatmap tools such as Figpii provide you with click heatmaps that record every activity on your website, every click on links, images, and sidebars, above the fold and below the fold, and this helps you understand how users are interacting with your website for you to provide a better user experience.
Every click is combined into a heatmap visualization showing you hot areas, where users focus, and cold areas, which users ignore.
With click heatmaps, you can’t see the mouse movements, but you can see the click patterns your site visitors make – the traditional F patterns and Z patterns.
These insights help you improve your web design, which ultimately enhances the user experience.
Another way click heatmaps improve your user experience is if your website click tracking reports show you that site visitors bounce without clicks and scrolls above the fold, which means there’s an issue with your design, colors, or other elements.
Each element should be A/B tested to see which variation improves the customer experience and retention.
Here’s an example of a click heatmap visualization using our tool Figpii.
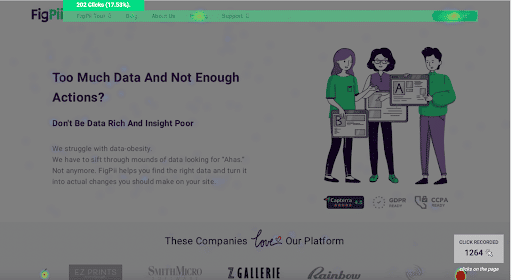
You can see the hot zone marked in green with the number of clicks.
Common Click Tracking Tools You Should Know Of.
To better understand user behavior, interaction, and navigation on your website, you need click maps and session recording tools.
Our tool of choice at Invesp is our proprietary tool Figpii which offers session recording and click maps.
Session recording allows you to view, analyze and see how a user behaves on your website from the moment they get in until they leave. It shows you everything, their navigation, etc.
Heatmaps are a visualization tool that records every click on your website. The clicks are not links only; they also include page scroll, mouse movements, image clicks, etc. This allows you to find out what users see as interesting on your website.
If you’re serious about improving conversions on your website and you’re not tracking user clicks, you’re leaving a lot of valuable, rich customer data on the table.
Click Data: Google Analytics and Tag Manager.
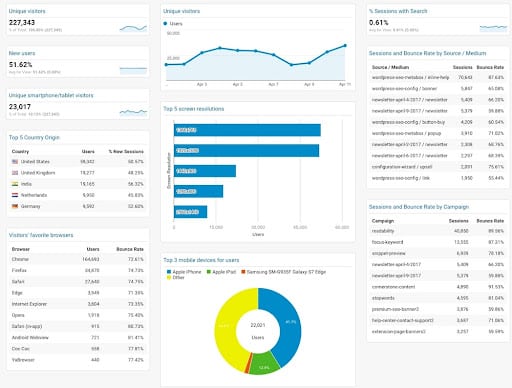
Google Analytics is a website analytics tool that doesn’t provide you information the way session recording and heatmaps do.
The data you get from GA is quantitative. It provides you with details about traffic sources (social media, referrals from other websites).
Google Analytics is best to find out what content works best on your website, the web pages with high bounce rates, high retention rates, etc.
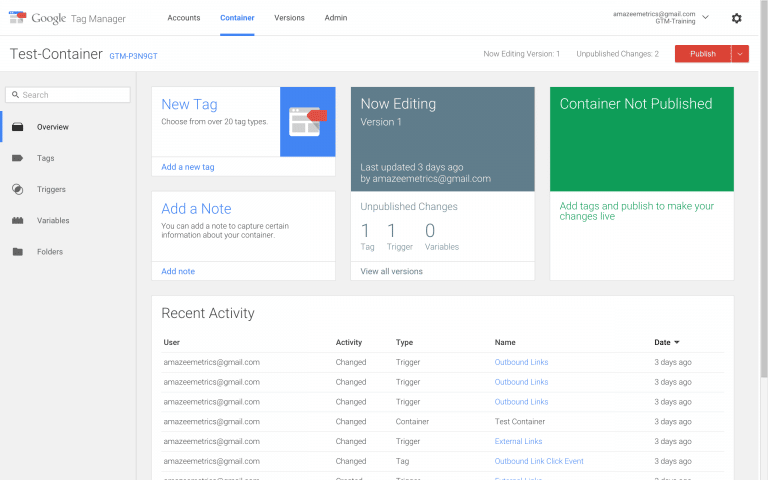
Google Tag Manager is a GA tool; it’s a tag management system that allows you to easily and quickly update Google Analytics tags on your websites and apps.
Once the small segment of Tag Manager code has been added to your project (website or app), you can safely and quickly deploy analytics and get reports on what users are clicking on your website.
Google Analytics and tag manager are fantastic tools, but they don’t work best alone. Combining GA with other click tracking tools like Figpii or hotjar to get a more holistic view of user behavior.
Users Clicks You Shouldn’t Track.
Not every link clicked on a website by users results in meaningful data for the marketer and therefore should not be tracked.
A classic example of links you should not track are ghosts and phantom links.
Just as the name implies, they’re not honest. They add details to your analytics data that skew the results you get.
One or more of these can cause your website to have phantom/ghost line=ks;
- Scripting error on the client’s side.
- Unattended bugs in your website application.
- Not correctly configured analytics software connected to your website.
Fix these issues, and you’ll drastically reduce the chances of having ghost/phantom links pop up on your website.
The Impact Of Apple Privacy On Email Link Tracking.
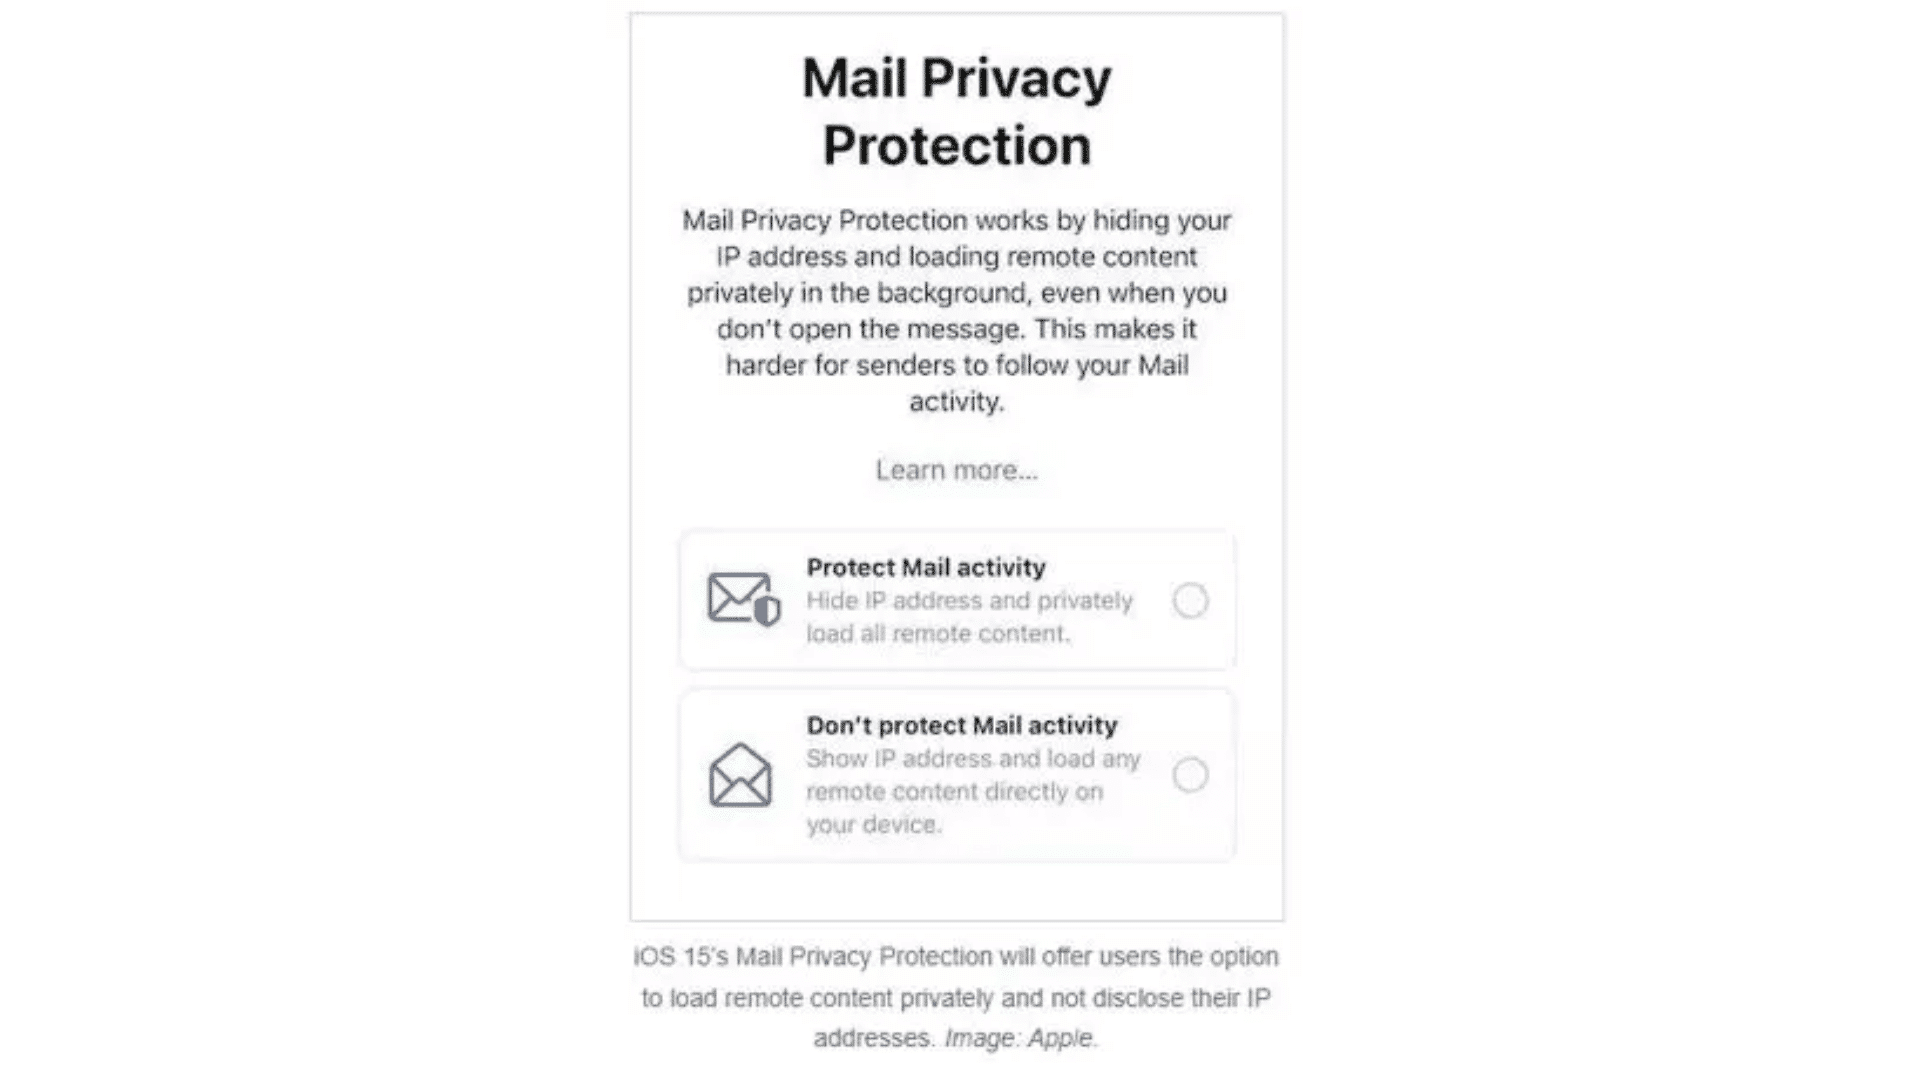
As of September 2oth, in its iOS 15 update, Apple made it difficult for email marketers to accurately track when a subscriber opens an email and their location.
The updated privacy works are simple; for users of Apple products who selected the protected mail activity, Apple will provide a general IP address back to the email marketer and not the subscriber’s specific IP.
This inflates the open rate, but it’s false data that can’t be trusted. It also impacted email marketers’ segmentation types, such as tracking subscribers by location.
Why is this a big deal? According to Statista, Apple Mail and Apple mobile devices account for 33% of the global email provider market share.
For email marketers who relied on the open rate metric and also A/B tested open rate increases based on send time and send day, their testing is compromised.
Marketers now have to focus on other metrics, such as the clickthrough rate from the email sent to judge subscriber activity.
How To Setup Click Tracking On Your Website Using Figpii.
You can use different tools to gather qualitative insight on your web visitors, but we often make use of Figpii.
It’s the tool we use for several of our clients, and other conversion rate optimization agencies use it.
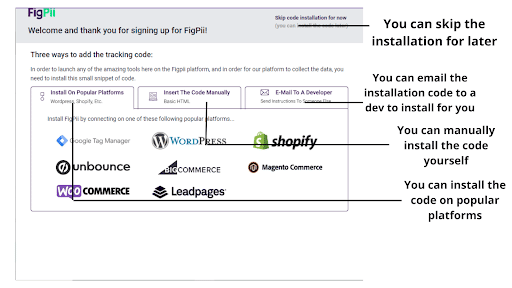
Figpii, as a click tracking tool, is easy to set up. You don’t need to be a developer, though that’s an option. You sign up and get the click tracking code installed on your website in three steps.
Whenever a user clicks on the page containing your click tracking code, it gets recorded as an event, and it shows you the data in the report section of the tool.
The first step is to sign up.
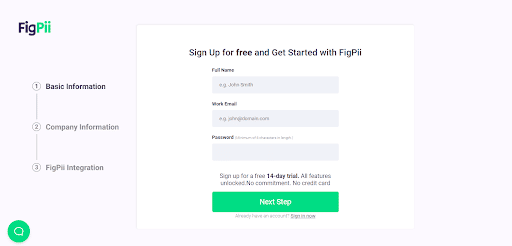
You input your name, work email, and a secure password, then go to the next step.
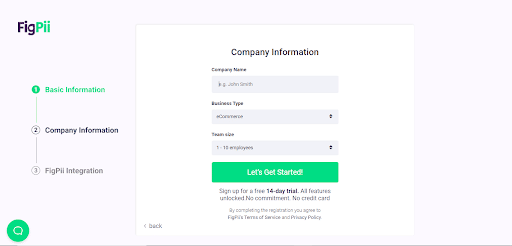
You follow the directions and input your company name, type of business (niche), and the number of employees.
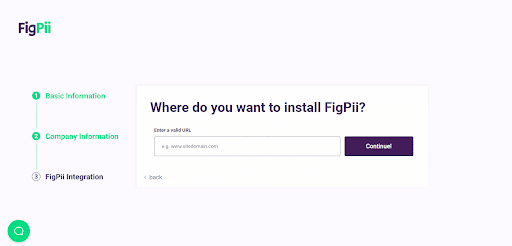
The final step to registering is to input your website address.
The next page is an invitation to a product demo with an expert and other steps to help you get started. You can skip all that and come back to them later.
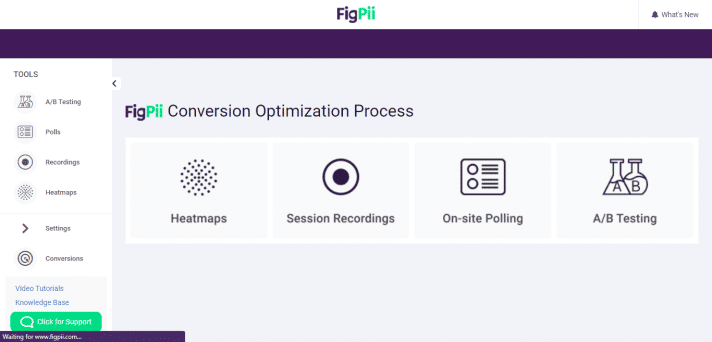
This is what the Figpii dashboard looks like. Figpii helps you collect qualitative data on your web visitors and customers, which informs your decisions.
With Figpii, you can do the following;
- You can watch session recordings of users on your website. You can see user behavior and navigation.
- It allows you to conduct polls and surveys on your website where you can pull in extra helpful information about your customers.
- You can see user heatmap recordings, user interaction above the fold, and what users are clicking on; you can also note cold areas on your website and optimize them for more interaction.
- Figpii also allows you to conduct A/B tests. Testing your hypothesis by creating a variation with our editor tool and validating your hypothesis.
Heatmap Click Tracking
Every feature of Figpii is fantastic, but as this topic is about click tracking, we’ll focus on heatmaps.
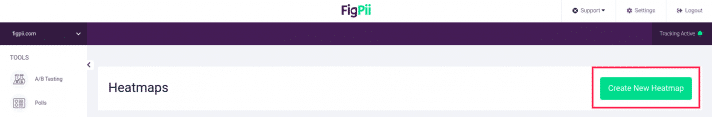
To run your first heat map is straightforward. Log into your dashboard and click on heatmap.

The next stage is for you to click on create a heatmap.
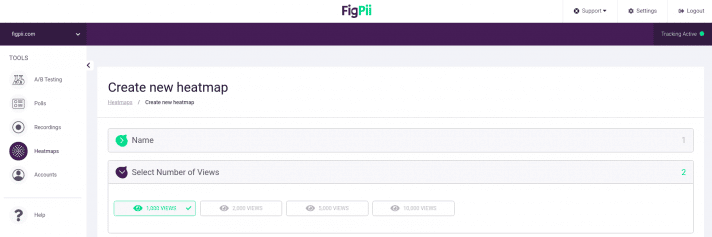
The next step is to give your heat map a name and choose the number of views based on your package.
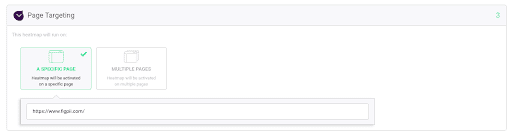
Next, choose your targeting and the page/pages you want your heatmap to run on.
The final stage is to choose the device you want to target.
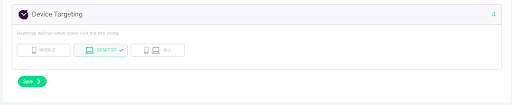
Now you can click save.
Professional tip: create separate heatmaps for desktop and mobile devices.
Conclusion
At the beginning of this article, I said click tracking is what the name implies (tracking clicks), but it’s also much more.
With the information available from observing user behavior and interaction with your website, email, and landing page, you can make better-informed decisions that will reflect on your conversion rate.
Learn something new? If you’ve got any questions, leave a comment, and share with your friends.


