
So it’s been a year since I started playing around with Google Analytics.
I vividly remember my very first day – I had no clue what the tool was all about, and I didn’t really know the importance of data in the world of marketing. What I thought was Digital Marketing, wasn’t really DM, but it was Social Media Marketing.
Not that I was ignorant or have been living under a rock, but I was coming from a totally different planet. For the life of me, I had not known any other home apart from sports journalism.
So when Khalid gave me my first lecture on Google Analytics, to be honest, I was intimidated by the tables, charts, numbers, and graphs. It wasn’t love at first sight, and I didn’t understand how all those concepts could be comprehended by a single human brain.
But as someone who was starting out in the world of Conversion Rate Optimization, I knew life was going to be much easier if I befriend GA and interact with it more and more. Afterall, GA is the most popular Web Analytics tool in the world and it is used by over 64% of the Top 500 US Retailers.
Even to this day, I’m still interacting with GA –and with every interaction, I’m getting comfortable. What started as a scary adventure, is turning out to be an exciting ride.
So, in just 3 000 words, I have decided to take you on my journey of learning and dissecting GA data. This is my first article on GA, who knows, one or two posts may follow later. If you’re just starting out to make sense of GA data, I’m sure you will benefit from this post.
In this guide, I will just assume that you have set up your GA account and you’re ready to explore the tool. Bookmark this guide and come back to it as your data tracking becomes more sophisticated. If you still have questions after going through this, feel free to slide into the comments section.
First things first: What is Google Analytics?
A quick search on Google defines GA as a free analytics tool — offered by Google — that gives you an extremely in-depth look at your web or app performance. But there is also a paid version of GA which is called Analytics 360.
Whether it’s a free or paid version, every data report in GA is made up of two types: dimensions and metrics. The difference between the two elements is crystal clear; dimensions reveal the features and characteristics of a website user, whereas metrics quantify the activities of the user.
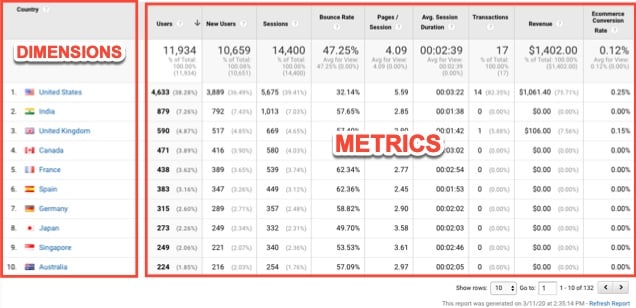
As you can see from the above image, dimensions are descriptive whereas metrics are quantitative in nature.
To help you understand, let’s just assume that a 27-year-old woman from Chicago visited your website after searching for ‘best laptop bags’ on Google via a safari browser in her iPhone 11 Pro. From this example, Google Analytics will capture the dimensions of this visitor and report them as follows:
- Gender: Female
- Age: 25-34
- City: Chicago
- Source/Medium: Google/Organic search
- Keyword: best laptop bags
- Browser: Safari
- Device Category: Mobile
- Operating System: IOS
Gender, Age, City, Source/Medium, Keyword, Browser, Device Category, and Operating System are all descriptive in nature –an indication that they’re dimensions. As you can see, GA doesn’t reveal users’ specific details such as name, mobile number or email address, so dimensions are the closest you can get to know your visitors.
As indicated earlier, metrics reveal the activities of visitors in numbers. You get to know things like the number of visitors who visited the site, visitor’s duration on the site, the number of visitors who left the site, and more.
To get the most out of GA you’ll need to know the most important metrics it provides. Some of these critical metrics are Bounce rate, Sessions, Traffic Sources, Pageviews, Conversions and Session durations (all discussed in great detail below).
Understanding Google Analytics Metrics
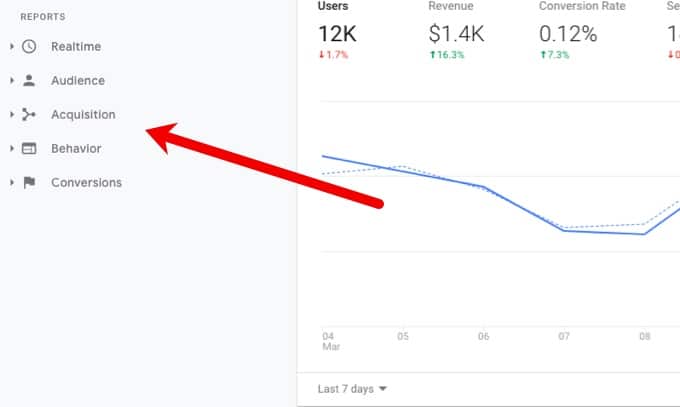
If you log in to Google Analytics, on the left-hand side of your tab you will see standard categories — Real-time, Audience, Acquisition, Behavior, and Conversions — under the standard reports section.
It is the information under these reports that paints a clear picture of how your website is performing. In fact, the Google Analytics reports are there to help reveal the success of a website based on its set. The data in these categories allows you to make smart, strategic and informed decisions about your digital marketing efforts.
So before I jump into the different subcategories under the standard report sections, it’s best that we start by defining important terms you will find in GA:
Visitors
New visitors: these are the visitors that Google Analytics considers as brand new visitors to the site. They have never visited the website before.
How does GA know if someone has visited the site before or not?
Whenever a user visits a site that uses Google Analytics for tracking, the GA will place a tracking cookie on that visitor’s device. So, if you use your desktop to visit a particular website, then GA will place a cookie on that desktop. If you visit the same site using a mobile device, then GA will place a cookie on the mobile device.
It gets even better, if you visit the same website, on the same device (desktop for example) but using two different browsers, then GA will put two different cookies on your device. Google Analytics uses a cookie to identify each user and the two different browsers would store two different cookies.
When a visitor views your website, Google’s tracking code looks for an existing tracking cookie on the device. If GA cannot find the tracking code on the device you will be using, then you are counted as a new visitor. If GA finds the tracking code, then you are counted as a returning visitor.
Session
A session begins when users visit a site and end when (1) they exit the site (2) they are inactive for 30 minutes (3) at midnight.
The session time limit is 30 minutes by default, but it can be adjusted up to 4 hours. When a user returns to a site after 30 minutes of inactivity, GA reports this as a new session.
To help you understand, let’s say user X visits a website and leaves it open for more than 30 minutes without interacting with it, GA automatically ends the session. When the same user (user X) returns to the site, GA resets the time and considers this as a new session.
Likewise, if user X visits a site at 23:56 pm and leaves at 00:05 am, this will be reported as two sessions. According to GA, the first session would have ended at 23:59:59 am and the new session is said to have begun at 00:00 am.
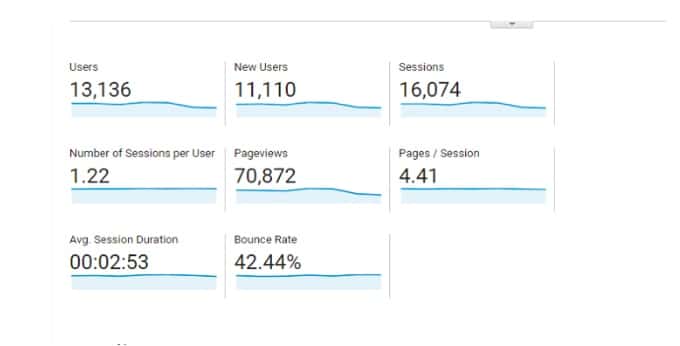
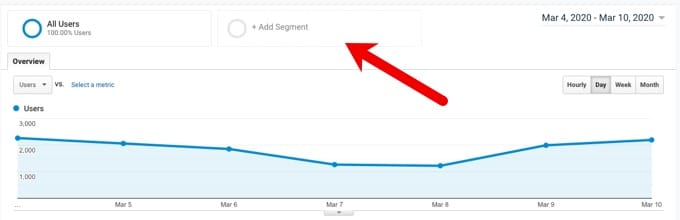
This explains why the above site had 13,136 users but GA reports that it generated 16074 sessions. Sessions are based on visits, and one user can have as many sessions. You can also see from the above image that on average each user visited the site 1.22 times, and with each session, the average number of pages visited is 4.41 pages.
Page view
A page view reveals the total number of times a page is viewed in a given period. GA reports page views based on one principle; one page visit equals one pageview.
Let’s take, for example, I vısıt page A on a websıte then jump to page B, then go back to page A. In this case, GA will show that page A has two page views and page B has one page view.
People tend to confuse the pageview metric with the number of users who visit a particular page. If you have been following this discussion, you will understand that it’s impossible for a single user to generate multiple page views during a single session.
In instances where a user refreshes or reloads a page, GA considers this as a new pageview. Depending on the type of website, sometimes this metric can indicate the popularity of a page.
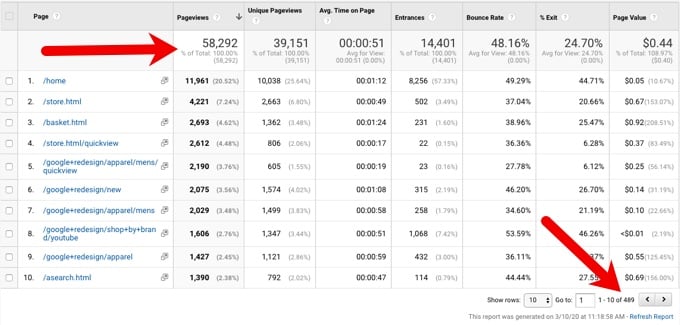
The above image shows 10 pages of 489. As you can see, all the 489 pages generated a total of 58,292 views.
Another interesting metric that I like to look at is the average number of views per page. The formula for this metric is:
The average number of views per page = total number of pageviews / the number of pages
For the site above:
The average number of views per page = 58,292 / 489= 119
So, on average a page on this site receives 119 page views within a week.
If you add the total number of pageviews generated by the first 10 pages, you will notice that the first 10 pages receive an average of 3220 views per week –and this means that they are performing way above (the 119) average.
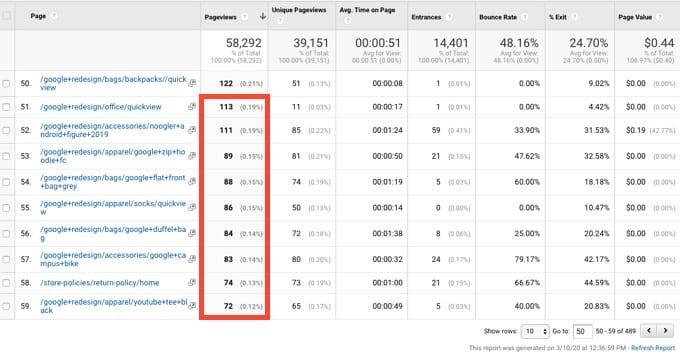
As I scrolled downwards to view how some of the pages were doing, I noticed that from page 51, the page views were now below average.
This is a cause for concern because you can’t be having only 50 pages – of a site that has a total of 489 pages – performing above average, in terms of page views.
Unique Pageviews
Unique Pageviews are pageviews that are generated during a specific session by the same user. Unlike the page views report, the unique pageviews metric is based on the principle: one session equals one unique pageview.
You can think of unique pageviews as user sessions per page.
This means that if one user views a page multiple times during a single session, GA will count this as one unique pageview. For instance, when a user first visits page A and moves to page B, and then goes back to page A during a single session, GA will report this as shown in the table below:
| Pageview | Unique | |
| Page A | 2 | 1 |
| Page B | 1 | 1 |
Bounce rate
A visitor is considered to have bounced after having landed on a web page and immediately leaving without visiting any other page on the site. Web analytics guru, Avinash Kaushik, defines a bounce from a visitor’s perspective as:
I came; I puked, and I left.
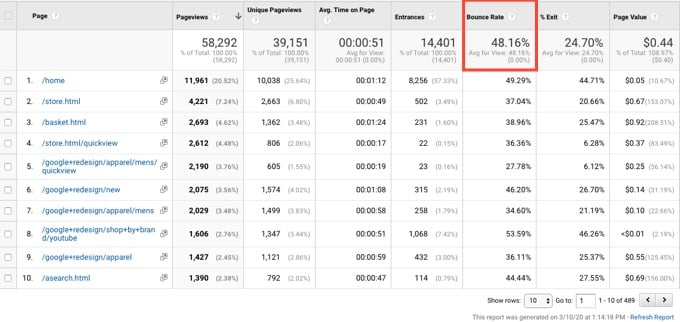
In the above image, 14,401 people visited the site, and 48.16% of those visitors bounced –meaning that they only viewed a single web page. GA doesn’t show you the exact number of people who bounced, but this is how you can calculate it:
The average number of bounced users = Bounce rate x Total entrances
So in this case, the bounce rate for the above site is:
= 48.16% x 14,401 = 6,936
To calculate the bounce rate, GA uses the following formula:
Bounce rate (of a page) = Visitors wıth single page exits / Visitors with a single-page visit
A bounce rate is the only metric that will tell you if visitors are staying on your website or not. Depending on the page on your site, a bounce rate can either be good or bad.
Exit rate
When people visit your site, at some point, they’re bound to leave, right? When this happens, Google refers to it as an exit. So an exit rate simply refers to the percentage of these site exits.
More often than not, the exit rate is confused with the bounce rate, probably because they both reveal the percentage of the users who left the site. However, it’s important to note that these are two different metrics.
Just to refresh your memory, the exit rate is the percentage of visits that were last in the session, whereas the bounce rate is the percentage of visits that were the only one of the session.
If you think about it, visitors who bounce on your site would have exited your site. So this makes the bounce rate part of the exit rate.
Having said that, here’s how GA calculates the exit rate:
Exit rate = Total number of exits / Total number of page views
For example, if a website has 60,000 page views and 20,000 total number of exits, GA will calculate the exit rate as follows:
Exit rate = 20,000 / 60,000 x 100 = 33%
Average time on page
When users visit a site and start moving from one page to the other, GA calculates the time they spend on each page. At the end of each session, this free web tool comes up with the average time that users spend on each page on your website.
So, you can think of the average time on page as the time spent by users interacting with a certain web page.
For instance, if a user visits page A at 13:05 pm and move to page B at 13:09 pm and then to page C at 13:16 pm before leaving the sıte at 13:18 pm, GA will report this as follows:
| PAGES | Enter Time | Time On Page |
| A | 13.05 | 00:04:00 |
| B | 13:09 | 00:07:00 |
| C | 13:16 | NA |
As you can see from the table above, GA comes up with the time spent on a page by subtracting the entrance time from the exit time. Drawing from the example above, this can be illustrated as follows:
Time spent on Page = Page B entrance — Page A entrance time
= 13:09 — 13:05 = 4 minutes.
Even though GA knows the exact time (13:16 pm) that the user visited Page C, it couldn’t calculate the amount of time spent on that page since the user didn’t navigate to another page or make any other interaction with the site.
From the moment a user visits a site, GA calculates the duration of each session based on their interaction on the site. If a user visits a site and doesn’t open any other page, Google Analytics won’t be able to record hits or track any movements, so this is considered as a bounce.
To come up with the average time on page, GA adds the number of minutes spent on the partıcular page and divides the total by the number of vısıtors to that page.
Average time on a page = Time on page A /Total number of vısıtors
Session duration
When you visit a website, navigate through it by going from one page to the other, as soon as you exit the site, GA calculates the time spent on the site and refers to it as session duration.
Google refers to session duration as the amount of time a user spends on a site.
To come up with the session duration, Google Analytics adds the number of minutes a user spends on each web page. This can be exemplified as follows:
Session duration = Time on Page A + Time on Page B + Time on Page C.
So, if a user spends 3 minutes on Page A, 4 minutes on Page B and 2 minutes on Page C, the session duration will be measured as follows:
Session duration = 3 minutes + 4 minutes + 2 minutes = 9 minutes.
There’s a difference between session duration and time spent on a page. The two metrics may be similar in that they show the time spent by users, but there are significantly different in that the session duration is inclusive of time spent on the site whereas the time on a page only shows the amount of time a visitor spends on a certain page.
Source
The last place that your web users visited before getting to your site is referred to as the source. It can be a social platform (Twitter, Facebook, etc) or a search engine (Google or Bing). Think of it as a place where your visitors are coming from.
In the event that GA cannot figure out the source or if the visitor typed the site URL or clicked on a browser bookmark, this source will be presented as a direct source.
Medium
Source and Medium in GA are terms that even the best marketers get mixed up sometimes. As mentioned earlier, the source is where your website’s visitors are coming from, whereas the medium is how the visitors got to your website.
This means that the Source of your traffic might be Bing, but the Medium could be Organic, CPC, Display or Referral.
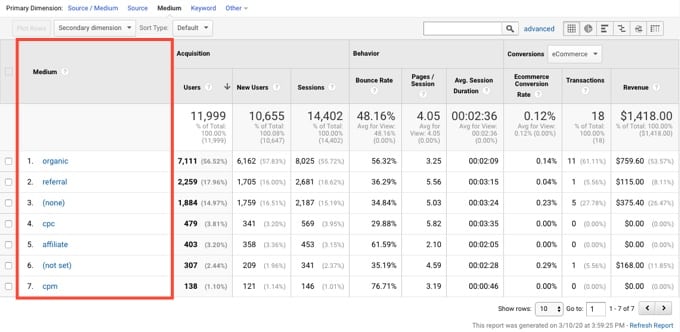
The above image shows some of the core categories within the Medium section in GA.
Channel
The GA channel is a group of several traffic sources that used the same medium to get into your website. There are two types of channels in GA: default and custom channels. Default channels are system defined channels in GA, whereas custom channels are user-defined.
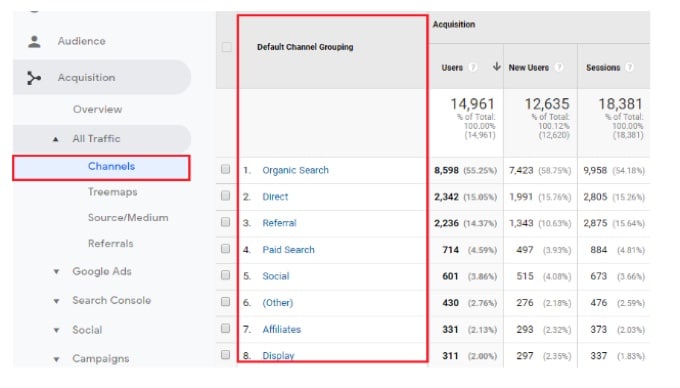
The image above shows some of the default channels in GA and the number of visitors that used a certain channel to get to your site. It is through this report that you get to see the performance of different marketing channels in driving users to your site.
Campaign
Any sources – ad campaigns, search engines, social networks, etc – that send users to your website are collectively known as campaigns and traffic sources.
Earlier on, I mentioned that there are some instances when GA is not able to detect the source of your web visitors. To avoid such instances, it’s best if you can use campaigns as a way of tracking specific traffic sources.
For instance, if you send out an email to your subscribers, and someone clicks on the link within that email and reaches your website, GA might not know the specific email that the visitor used to get to your website. This is where Campaigns within Google Analytics come in handy.
Besides being able to trace the specific sources of your visitors, GA’s campaigns can help you track your Return On Investment (ROI) of traffic from different sources.
But in order to track campaigns in GA, you will have to do some setup first.
Understanding visitor segments
Now that you have a basic understanding of the lingo used in GA, let’s drill deeper into your visitor data.
At some point, you might really want to find out how your new visitors are interacting with the site vs. returning visitors. Or you might want to see how visitors who converted interact with the site vs visitors who did not convert.
So, how do you go about this?
Most sections of Google analytics allow you to create a custom visitor segment. It also includes pre-built segments for your analysis:
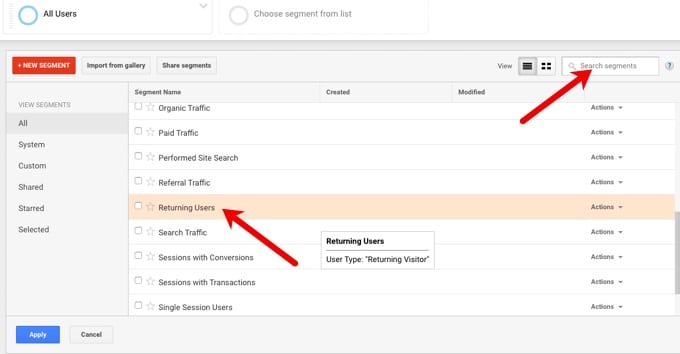
You can either search for a segment in the search box or scroll through to see what segment is available.
In the picture above, I wanted to see how my returning users interact with the site.
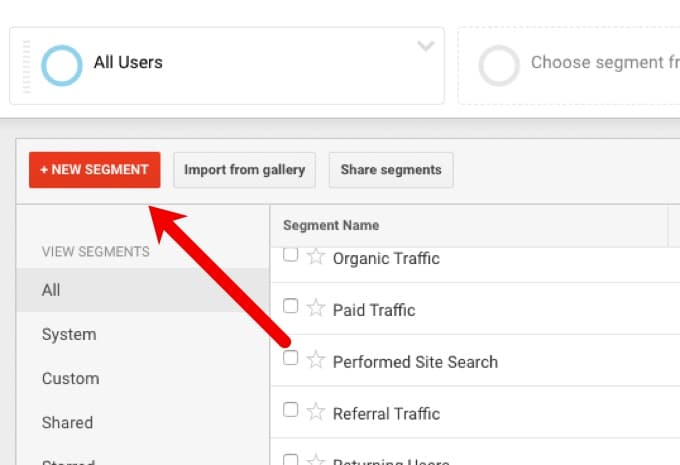
For an e-commerce site, if you want to see how those visitors who placed an order with the site behave then you will have to create your own custom segment.
Start by clicking on the red button:”+ NEW SEGMENT”
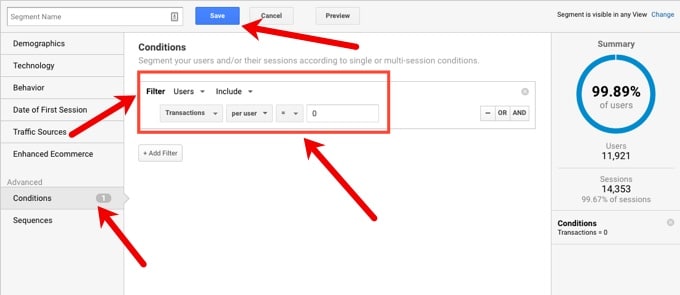
Click on conditions from the left navigation (under advanced)
Select “Users” from the drop-down
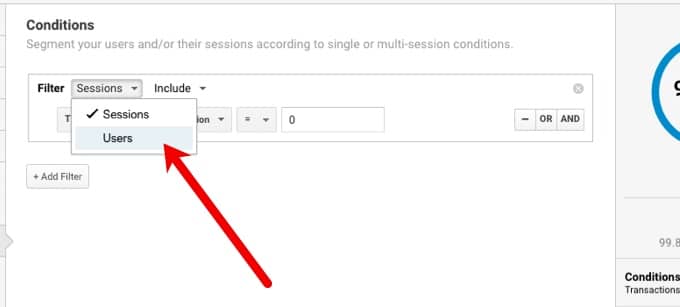
3. Select “Transactions”
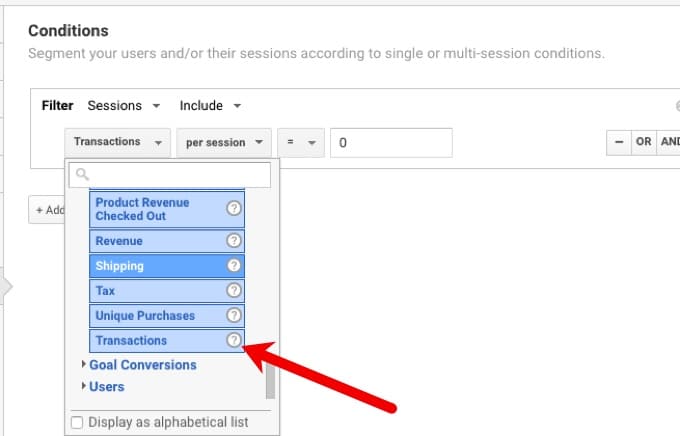
4. Select per user
5. Select >
6. Input 0 in the box
7. Input a name for this segment. I used Visitors with transactions – but feel free to use whatever you like!
8. Click on the blue save button.
What does this all mean? I basically told GA to create a new segment. This segment is for all users who have a transaction with the site.
What if we want to create a segment for visitors who did not place an order on the site?
We follow the same steps:
- Click on conditions from the left navigation (under advanced)
- Select “Users” from the drop-down
- Select “Transactions”
- Select per user
- Select “=”
- Input 0 in the box
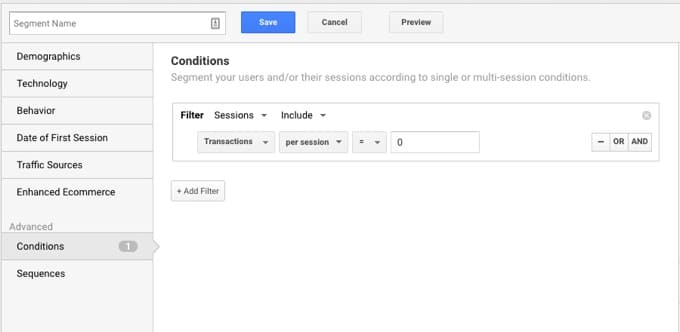
7. Input a name for this segment. I used “Visitors without Transactions” – but feel free to use whatever you like!
8. Click on the blue save button.
This is just the beginning
We’ve just scratched the surface, there is so much more to explore in GA. I still haven’t touched Google Analytics’ reporting tabs: real-time, audience, acquisition, behavior, conversions, and even custom dashboards. But let’s leave that for the second and third installments. In the meantime, you might want to check this free GA video course offered by Google.


