
Here’s a thought experiment for you.
What do you think is the one thing that’s important to several business owners and C-suite folks across different verticals?
If your answer is more conversions, then you’re correct.
Everyone wants it, and that’s because more conversions signify an increase in their bottom line. However, the challenge lies in figuring out how to convert more on-site visitor clicks into actual conversions.
Enter A/B testing frameworks.
In this article, I’ll define what an A/B testing framework is, emphasize the importance of having an A/B testing framework, and discuss the 7-step A/B testing process.
Understanding and implementing these strategies can optimize your website’s performance and ultimately increase conversions.
Let’s get started.
What is An A/B Testing Framework?
An A/B testing framework refers to a structured approach or set of guidelines organizations follow to conduct A/B tests effectively.
It provides a systematic process for planning, executing, and analyzing A/B tests to make data-driven decisions and optimize key metrics.
An A/B testing framework aims to provide a standardized methodology that helps businesses ensure consistency, reliability, and accuracy in their experimentation efforts.
By following a framework, organizations can effectively compare two or more variations of a webpage, feature, or design element to determine which version performs better in terms of predefined metrics.
Importance of having an A/B Testing Framework
A well-established A/B testing framework provides numerous benefits for businesses and organizations. Let’s explore some key advantages:
1. Data-driven decision-making:
An A/B testing framework enables data-driven decision-making by allowing businesses to make informed choices based on actual user behavior and preferences.
Instead of relying on assumptions or gut feelings, A/B testing provides concrete evidence of what works and what doesn’t. By collecting and analyzing data from experiments, businesses can gain valuable insights that guide them toward making optimal decisions.
This approach minimizes the risk of making choices based on personal biases or subjective opinions and promotes a more objective and evidence-based decision-making culture.
2. Product and feature validation:
A/B testing is an effective method for validating new product features or ideas before fully implementing them.
Businesses can gather feedback and measure the impact on user engagement, conversion rates, or other key metrics by testing different variations of a feature or product with a subset of users.
This validation process helps mitigate the risk of investing resources in developing features that may not resonate with users or fail to achieve the desired outcomes.
A/B testing allows businesses to iterate and refine their products based on real user feedback, ensuring that only the most successful features are implemented on a larger scale.
3. Cost-effective decision-making:
Implementing changes or launching new features without validation can be costly if they fail to achieve the desired results.
A/B testing provides a cost-effective approach to decision-making by reducing the risk of investing in unsuccessful initiatives.
By testing variations against a control group, businesses can identify and implement changes that positively impact key metrics while avoiding unnecessary expenses on ineffective modifications.
This iterative approach helps allocate resources more efficiently by focusing on initiatives that are more likely to yield desired outcomes.
4. Improve user experience:
A/B testing empowers businesses to optimize the user experience by identifying and addressing pain points, usability issues, and areas of improvement.
Businesses can determine which changes resonate best with their users by testing different design elements, layouts, or content variations.
This iterative process allows for continuous user experience refinement, resulting in improved usability, increased engagement, and higher conversion rates.
A/B testing provides a data-backed approach to tailoring the user experience to meet the specific needs and preferences of the target audience, ultimately leading to higher user satisfaction and loyalty.
5. A culture of continuous improvement:
Implementing an A/B testing framework fosters an organization’s continuous improvement culture.
By embracing experimentation and data-driven decision-making, businesses encourage teams to explore new ideas, challenge assumptions, and seek evidence to support their proposals.
A culture of continuous improvement promotes innovation, collaboration, and learning from successes and failures.
It encourages teams to adopt a growth mindset and embrace the idea that there is always room for improvement.
A/B testing becomes an integral part of the organization’s DNA, driving innovation and optimization across various aspects of the business, from marketing campaigns to website design to product development.
A/B Testing Process
1. Collect data/Identify issues:
In order to conduct effective A/B testing, it is crucial to collect data from various sources to gain insights into user behavior and preferences. There are several methods and tools available to help you gather valuable information:
-
Google Analytics:
The beauty of Google Analytics4 is that you can see the overview of engagement on your landing pages (product pages) and dive deep into individual pages to investigate conversion issues.
Here’s how to go about it step-by-step.
Click on the reports tab on the left portion of the screen.
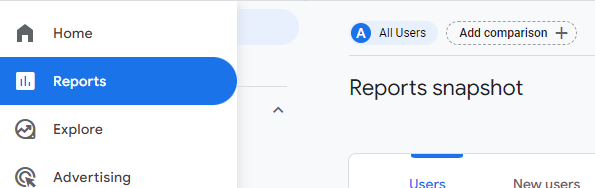
Click on the dropdown arrow for engagement.
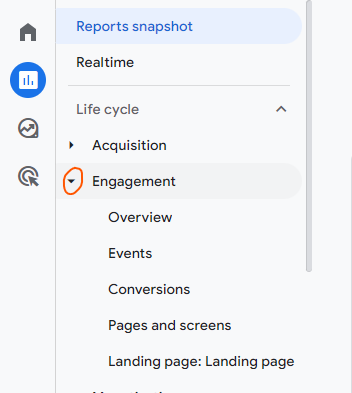
The next thing you can do here is check out the overview, or click directly on the Landing page to see how each landing page performs.
Available metrics that give further insight are – average engagement time, bounce rate, total revenue, users, and new users.

Tip: Look at the bounce rate metric and total revenue metric. For any product page that has an unusually high bounce rate, note it down for further analysis.
For any product page that the total revenue is doing badly, note it down for further analysis.
-
Surveys:
Conduct surveys to gather feedback from your site visitors directly. Ask them about their experience, what they liked or disliked, and any suggestions they may have.
Surveys can provide qualitative insights into user preferences and pain points.
One powerful way to use surveys is to launch them on pages with a high bounce rate/low conversions.
The idea is to get feedback from your site visitors on those pages on why they’re leaving early or not converting.
Here are some questions you can ask in this type of survey (open-ended questions):
– What brought you to our website today, and what were you hoping to achieve or find on this specific product page?
– Can you describe your initial impression of the product page? Was there anything that stood out to you positively or negatively?
– What factors influenced your decision to leave the page without taking any further action or exploring other areas of our website?
– Were there any specific elements or information missing from the product page that you expected or would have liked to see?
– If you could change one thing about the product page to make it more appealing or engaging, what would it be and why?
-
User Interviews:
Engage in Jobs-to-be-done customer interviews with your users to delve deeper into their experiences.
By asking targeted questions, you can uncover valuable insights that might not be captured through other data collection methods.
Examples of insights you can uncover from these interviews are;
– how they use your product.
– their overall perception of your brand.
– what features are missing that’ll make them stick around longer, etc.
The fact is, user interviews offer qualitative data that can help you understand user motivations and frustrations.
Here are some questions you can ask during one-on-one interviews:
– How did you first hear about our product?
– Can you describe the specific problem or need that led you to seek out a solution like ours?
– What alternatives did you consider before choosing our product?
– What convinced you to try our product over other options available to you?
– What specific goals were you hoping to achieve by using our product?
– Can you walk me through your steps to integrate our product into your daily routine or workflow?
– What key factors influenced your decision to continue using our product?
– Have you encountered any challenges or obstacles while using our product? If so, how did you overcome them?
– How has our product changed or improved your approach [related task or activity]?
– Are there any additional features or capabilities you wish our product had to meet your needs better?
Heatmaps and Session Recordings:
Heatmaps provide visual representations of user interactions, highlighting which areas of your website receive the most and least attention.
Session recordings allow you to replay user sessions and observe how users navigate through your site.
Consider this; you can see on your Google Analytics that certain pages have high bounce rates or low conversions.
You can guess why, but you don’t know if your site visitors interact with the conversion elements on those pages.
Heatmaps and session recordings show you if your site visitors interact with the necessary elements, where they fall off, and other unique behaviors.
These tools offer valuable insights into user behavior, including clicks, scrolls, and mouse movements.
Deep Dive: Qualitative vs. Quantitative Research
2. Prioritize issues:
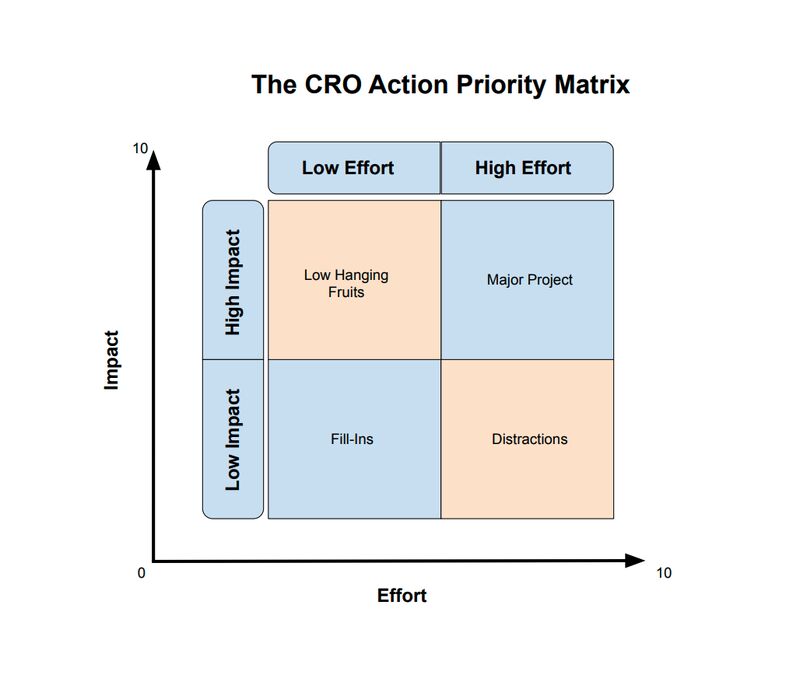
Not all identified issues have the same impact on your business. To prioritize effectively, consider the effort required to address each issue and the potential impact (outcome on revenue.)
One useful approach is to create a prioritization quadrant, where issues are plotted based on effort and impact.
Focus on high-impact, low-effort issues to achieve maximum results. This approach ensures you allocate resources efficiently and tackle the most critical issues first.
Here’s a quadrant you can use (the CRO priority action matrix):
You can also use a simple prioritization framework from Khalid Saleh, CEO, Invesp;
“ The closer a conversion issue is to the purchase point, the more critical it is to fix that problem.”
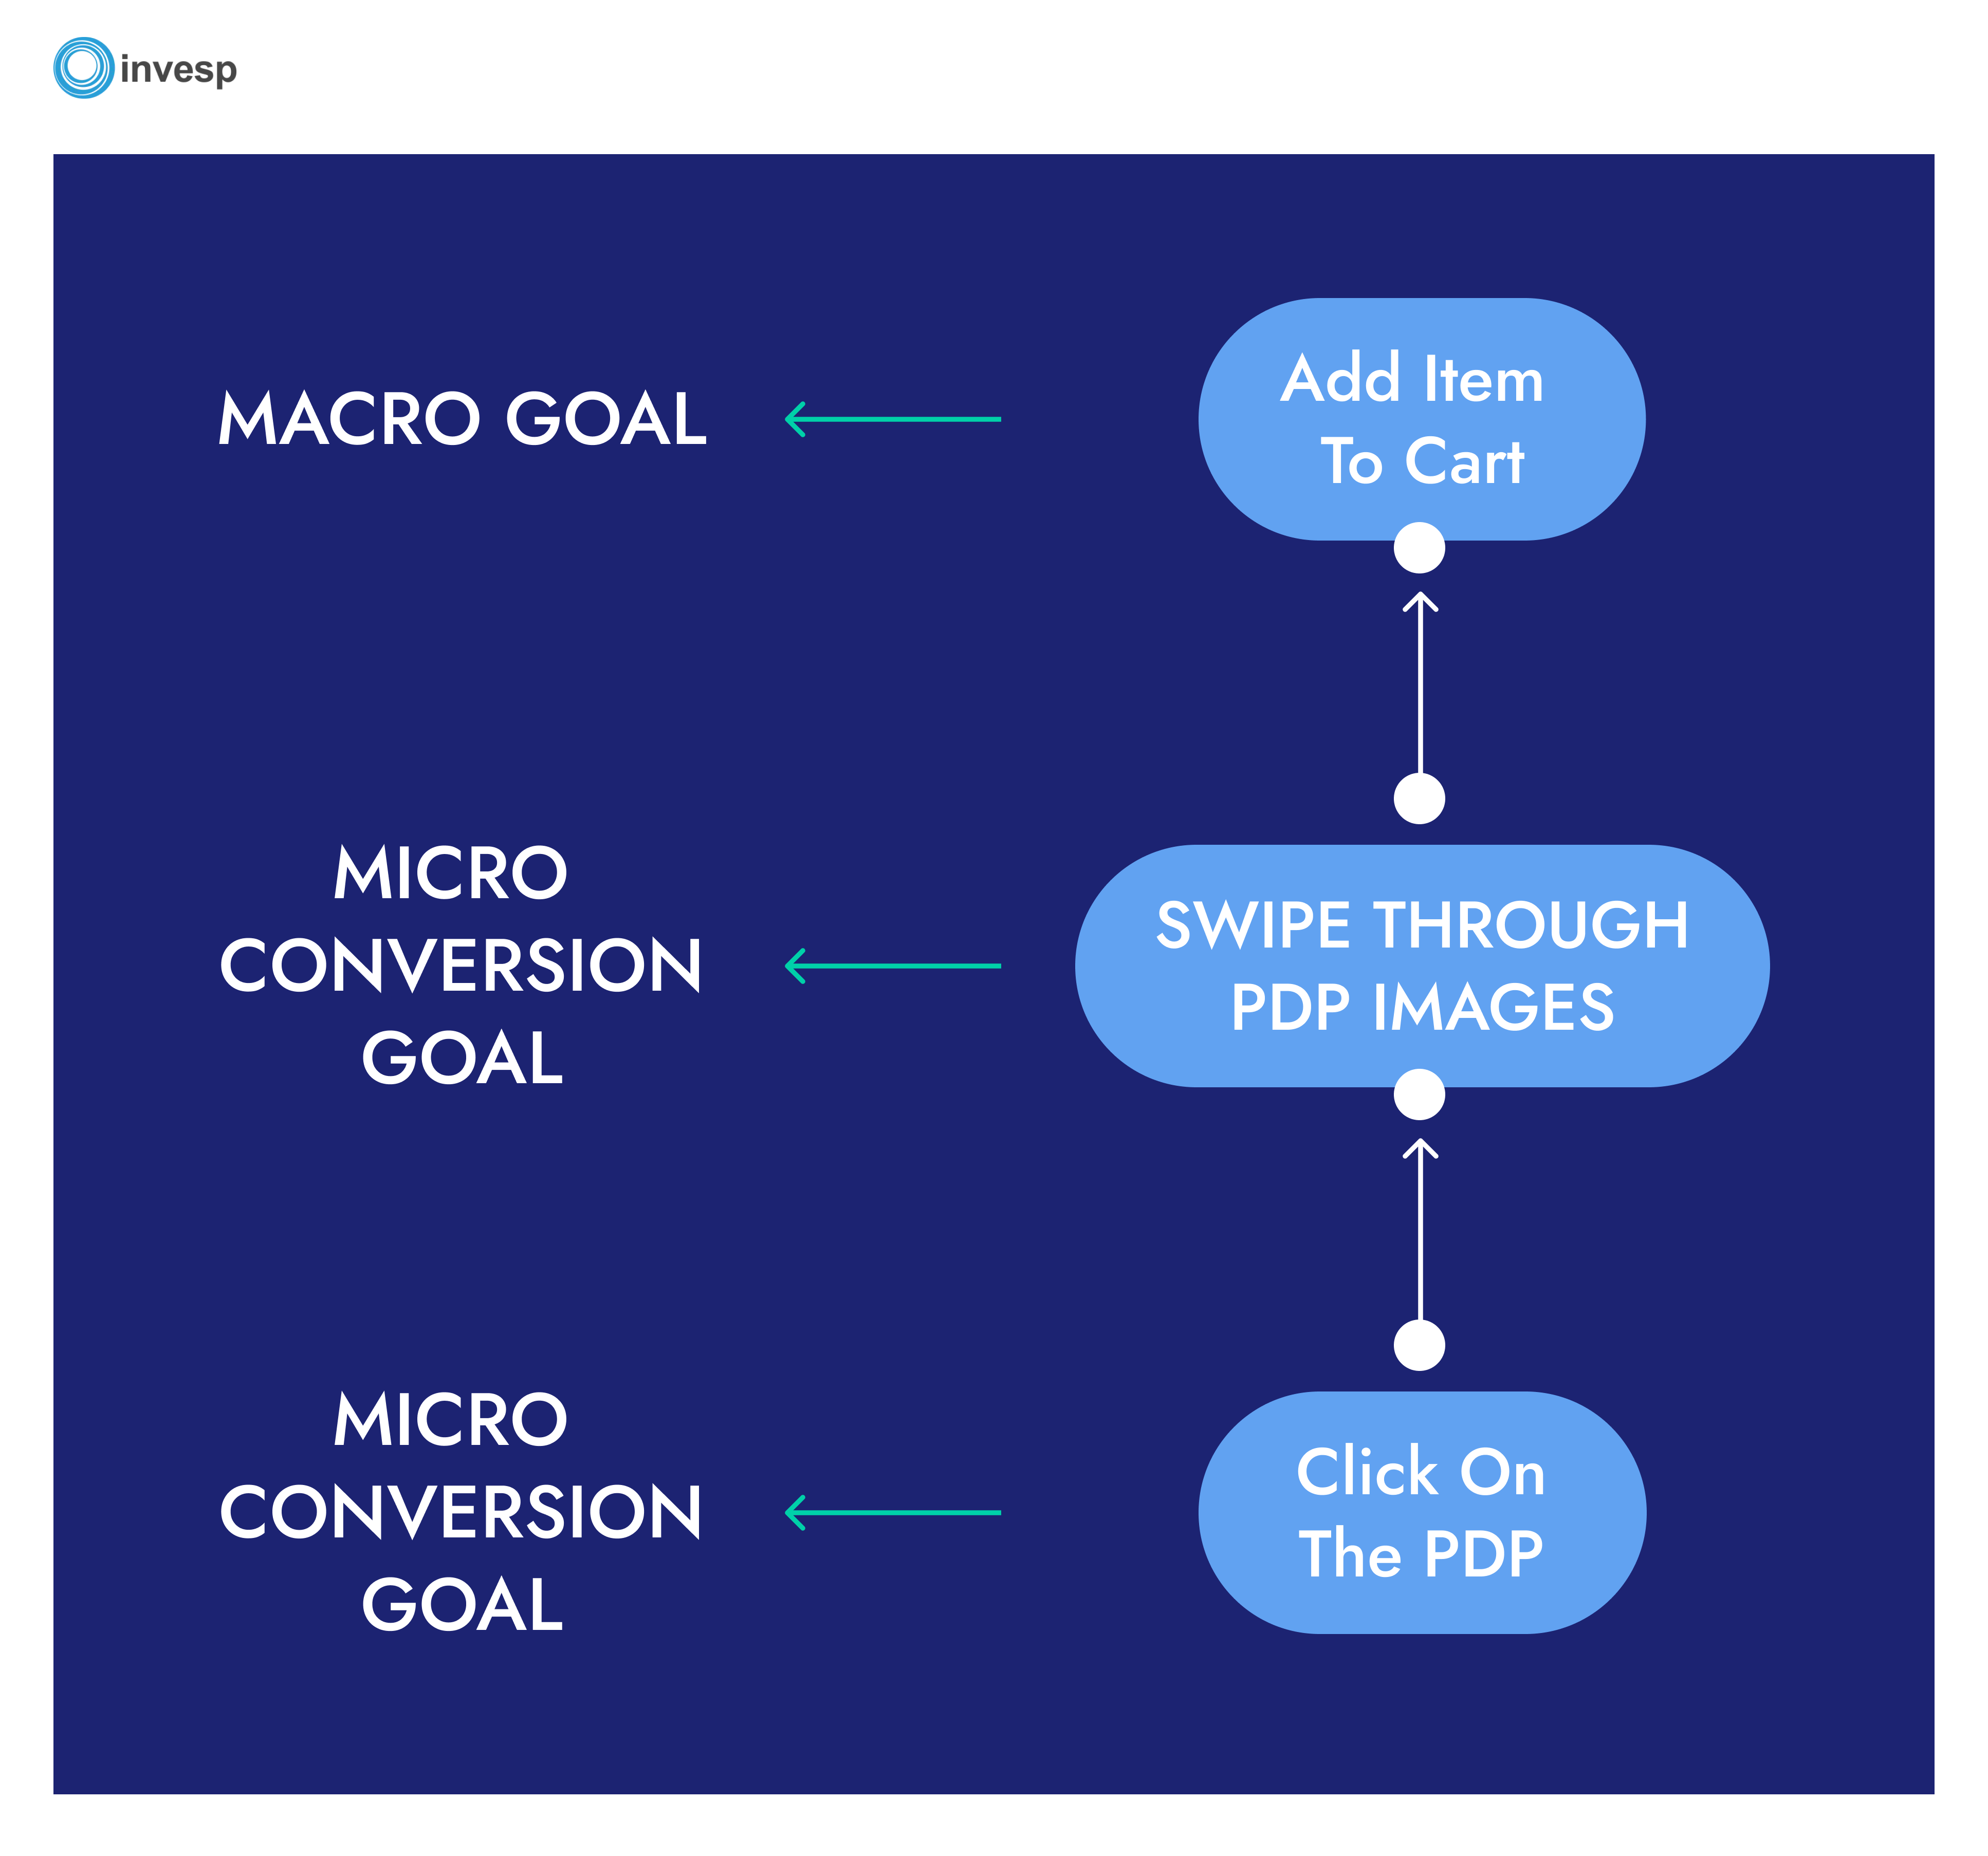
3. Identify your conversion goals:
Conversion goals are the metrics you use to determine the success of your A/B testing variations compared to the original version.
When setting up your A/B tests, there are three sets of goals you can choose from:
- Macro conversion goals: conversion goals that add to your bottom line, e.g., order confirmations and subscriptions.
- Micro conversion goals: these conversion goals represent incremental progress in the overall conversion process, e.g., adding an item to a cart.
- Revenue goals: Revenue goals in A/B testing refer to the revenue a company aims to generate through A/B testing.
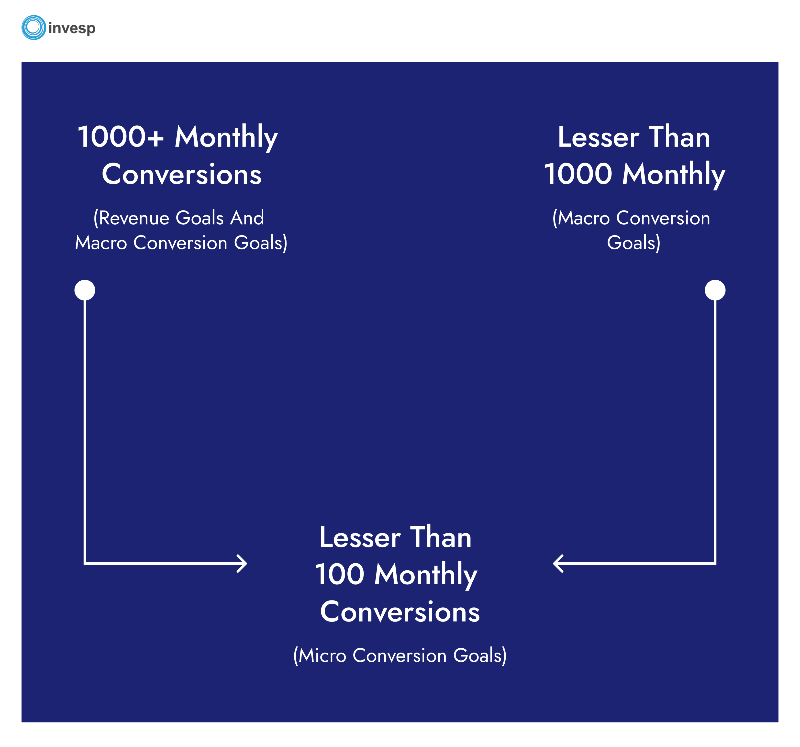
Here is the thing. The goals you choose are determined by your site’s conversion landscape (number of monthly conversions). In other words, your monthly conversions will determine the goals you pick.
Consider this scenario;
Let’s say your site gets 350-400 monthly conversions… it will probably take 4–6 weeks to reach statistical significance if you set up a macro conversion as the goal.
On the other hand, with 3,000-4,000 monthly conversions, you will reach statistical significance faster. 2-3 weeks tops.
For businesses with limited conversions (30-50 per month), it’s better to go for micro-conversion goals, as they represent incremental progress in the overall conversion process.
Use this diagram to determine the type of goal to assign to your A/B tests based on your conversion numbers.
See examples of different types of conversion goals:
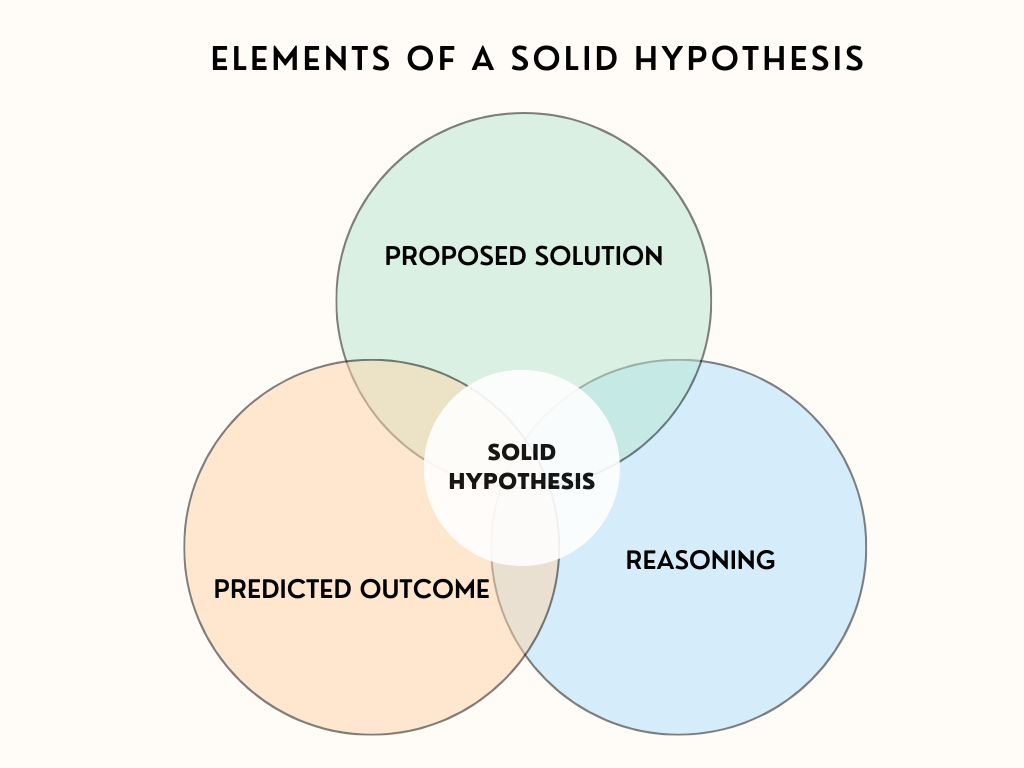
4. Formulate a hypothesis for issues:
Formulate a hypothesis that addresses the identified issues based on the evidence gathered from your research.
A well-crafted hypothesis consists of three key elements:
- Proposed Solution: Clearly state the change you plan to make to address the issue. For example, “If we modify the checkout process to include a progress indicator, users will find it easier to complete their purchases.”
- Predicted Outcome: State the expected impact of the proposed solution on your conversion goals. For example, “This modification will reduce cart abandonment rates by 20%.”
- Reasoning: Explain logically why you believe the proposed solution will have the predicted outcome. Refer to the insights and data collected during the research phase to support your reasoning.
Here’s a hypothesis formula you can use:
Hypothesis Formula: If we make change X, it will improve the member experience in a way that improves metric Y.
5. Set up your experiment:
In this stage, you will set up variations of a page or page elements to test against the original version.
Here are the key steps in this phase:
- Select a Sample Size: Determine the subset of site visitors participating in the A/B test. The sample size should be statistically significant to ensure accurate results. Larger sample sizes generally yield more reliable results.
- Define Confidence Level: Set the desired confidence level, typically 95%, to determine the level of certainty required to declare a winning variation. This helps you assess the statistical significance of the results.
- Timeframe: Determine the duration of the experiment. Consider factors such as the expected traffic volume, conversion rates, and the time required to collect sufficient data for analysis.
- Experimentation Tool: Choose a reliable A/B testing tool to assist you in setting up and managing your experiments. Figpii is a popular tool with a user-friendly interface and robust tracking capabilities.
6. Analyze your A/B test results:
When analyzing your A/B test results, pay close attention to statistical significance. Statistical significance helps determine if the observed differences between variations are due to chance or if they represent real effects. Consider the following steps:
-
- Calculate Statistical Significance: Use statistical analysis methods such as p-values or confidence intervals to assess the significance of the observed differences between variations. This helps you determine if the results are statistically meaningful.
Conclusive Results: There are several things to consider in this scenario. One winning variation and multiple winning variations.
One winning variation:
Inexperienced optimizers will immediately implement the winning variation, but experienced optimizers know it’s better to determine if the test results are valid.
For instance, let’s say you were testing the control against four variations (V1, V2, V3, and V4), and V4 won. The next thing you should do is re-run the test; this time, you should only test the control vs. the winning variation (V4, in this case).
If the initial results are correct, V4 will win again, and you can draw some learnings that you can propagate across the site.
The other thing you should consider doing after having a winning variation is to allocate 100% traffic to the winning variation. This means pausing the experiment, duplicating it, and resetting the traffic allocation.
Multiple winning variations:
There are different approaches you can use here. The first is running the tests within the winners to get a single winner from the lot. This helps to simplify your decision-making.
The second approach here is to evaluate all winning variations based on these metrics :
Traffic source
Visitor type (new vs. returning)
Browser type
Device type (it’s recommended that you test mobile and desktop devices separately to see which one performs better than the other)
Analyzing your visitors’ behavior under these segments can help you reveal new insights about their perspectives.
Depending on the design differences in those winning variations, sometimes you may need to mix the design elements of those multiple winning variations into a single design to find the best experience.
Losing Variations:
An A/B test is said to have lost when the variations fail to outperform the control in terms of the primary goal set and secondary goals.
Following best practices doesn’t guarantee success, but every situation has a silver lining.
In the context of A/B testing, losing variations are not bad –they present a goldmine of information you can use to; hone in on expectations that your website is not meeting, focus your testing and make improvements that will guarantee long-term success.
In simpler terms, losing variations are just as actionable as winning variations. When your test loses, you should: #
Evaluate the solutions you had in your variations: a single hypothesis can have several solutions, and it’s possible the solution you implemented in this losing variation didn’t sit well with your site visitors.
Go through your hypothesis: a hypothesis is a prediction you create prior to running a split test. A good hypothesis reveals what will be changed and how the changes will increase the conversion rate. Through A/B testing, a hypothesis can be proved or disproved. If you run a split test and your variation(s) fails to beat the original, this can be a confirmation that your hypothesis or prediction is wrong.
Revalidate your research data: this means returning to your initial quantitative and qualitative research to see if you missed any important detail.
Inconclusive Results:
Gather additional data or refine your hypothesis if the results are inconclusive or not statistically significant. Consider running follow-up experiments or making further adjustments based on the learnings from the initial test.
7. Share learnings:
Sharing your A/B testing learnings is crucial for fostering a culture of experimentation within your organization. By sharing insights and outcomes, you encourage collaboration and inspire others to adopt a data-driven mindset.
Here are some steps you can take:
Internal Communication: Share the results, insights, and recommendations with relevant teams or stakeholders within your organization. This helps disseminate knowledge and create opportunities for cross-functional collaboration.
Documentation: Document your A/B testing process, including hypotheses, variations, results, and the impact on conversion goals. This documentation serves as a valuable resource for future tests and allows you to build upon previous findings.
Borrowing Ideas: By sharing learnings, you enable others to borrow successful ideas and strategies from your experiments. This knowledge exchange can spark innovation and accelerate optimization efforts across different teams or projects.
Following a structured A/B testing process and leveraging data-driven insights, you can continuously improve your website or product, enhance the user experience, and achieve better conversion rates.
Final Thought
Launching experiments is one way to stay ahead and always provide better options to your site visitors. If you follow the process in this article from start to finish, you’ll always be launching experiments that have the potential to move the needle for your business.
