
One of our main jobs as digital marketers is to always look to enhance the customer experience on every touchpoint that customers might have with our brands.
Without tracking several key performance indicators, it’s impossible for any of us to deliver a positive customer experience.
If you ask any digital marketer, they will tell you that today almost nothing goes unmeasured. In fact, today’s marketing subscribes to Lord Kelvin’s way of thinking: “If you can’t measure it, you can’t improve it.”
This principle is also applicable to the department of customer service. Without gauging a business’s relationship with its own consumers, there’s no way you can improve it.
There are quite a number of customer service/support metrics that can tell you (1) how healthy your business is, (2) and how productive your service/support team is.
So if yours is a business that intends to grow and increase conversions, then you should be tracking all of the metrics that are discussed below.
There are quite a number of customer service metrics you can track, but we have handpicked the most crucial ones that you should be tracking no matter how small your service/support team is.
What makes a good customer service metric?
This is a good question for any company that seeks to make its customer service team more efficient. As I have already indicated, there are many customer service metrics that can be tracked – but the most important ones have to have these 5 characteristics:
Meaningful: A metric should always tie back to business-oriented goals. For instance, when your goal is to respond as quickly as humanly possible, the average time to first response is an ideal metric. First contact resolution time may not matter.
Easily measurable: A good customer service metric should be relatively simple to measure –there’s actually no need to overcomplicate metrics. A metric not worth measuring is the one that requires you to build a new system or implement a complicated process just to measure it.
Authentic: Business decisions are always influenced by reports –and once a decision is made based on a fake report, then it might cost you customers and affect the revenue. This is Barb Easter, Dryrun’s Director of Customer Engagement says:
Without accurate data, it’s difficult to determine what types of metrics are valuable; conversely, without clear goals defining which metrics carry the most impact for your team, you’ll get lost in meaningless reports.
Contextualized: When in isolation, numbers can be stripped of meaning. This is why you need to make it a point that your metrics provide context.
Comparable to competitors’ metrics: It’s important to track your progress against competitors. This will help you judge how well your business is doing when it comes to satisfying your customers.
Customer service/support metrics that matter
Customer service/support metrics can be grouped into two groups: Customer Experience and Operation metrics.
Customer experience metrics involve the customers’ input. They help you understand how loyal or happy your customers are. 52% of U.S. customers have switched providers in the last year because of negative customer experiences, it’s essential that you track your customer experience metrics.
As you might have guessed, operational metrics are obviously different from customer experience metrics. This group of metrics is all about the performance of your service and support teams. I mean, operational metrics will tell you everything you need to know about employee efficiency.
Now that you have an idea of what customer service/support metrics are all about, it’s time to explore what the customer service/support metrics encompass. Let’s begin by looking at Operational metrics:
First Response Time/ First Reply Time
Research across different industries bears that customers don’t want to be kept waiting for long. In fact, they want a resolution to a problem or an answer to be provided right after asking for it.
Customer satisfaction—for virtually any type of customer service—strongly correlates with first contact resolution. This is why 77% of consumers say valuing their time is the most important thing a company can do to make them satisfied.
The first response time, also known as the first reply time, is a metric used to measure the number of minutes (or hours) elapsed between the time a customer submits a case and the time they get a response. To avoid being penalized for the time off the clock, measure this metric in business hours.
According to Jitbit’s Max AL Farakh,
Response time is what really matters to customers if you are doing email or social media support and it should be one of your goals to keep it low. Ideally, less than two hours.
The first response is the customer’s first impression of your support team. If you want to satisfy your customers, then it’s best that you keep the first response time as short as possible. The shorter it is, the happier the customers will be. Tracking this metric helps you see if you’re leading with a good impression.
Needless to say, if customers don’t get a response soon enough, they are more likely to jump ship and head to your competitors.
As a way of countering long wait times, companies rely on chatbots. Unlike human customer service representatives, chatbots are always available 24/7. This means that you can count on chatbots to respond to customers’ queries even in the middle of the night, on weekends, or on holidays.
With that said, here is the formula for calculating the first response time:
Average first response time = Time of response – Time of customer request
Overall Resolution Rate
There are many ways you can gauge how well you meet the Service Level Agreement –and one reliable way of doing so is measuring the Resolution Rate.
You can basically think of the overall resolution rate as the percentage at which your company fulfills customer requests.
Depending on the channel they use to contact you with a service request, customers are more likely to have different resolution expectations. A customer that calls you on the phone will obviously expect a prompt solution from one who gets hold of you via email.
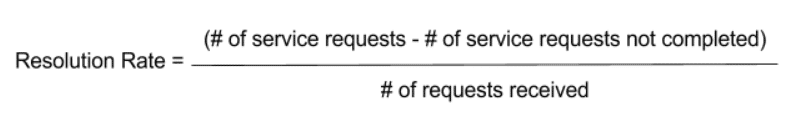
As seen above, the overall resolution rate can be calculated by dividing the total number of tickets by the number of tickets solved.
Resolution Rates can vary from industry to the other, but in most cases, resolving a customer query within 24 hours of the first contact is a good timeframe to aim at.
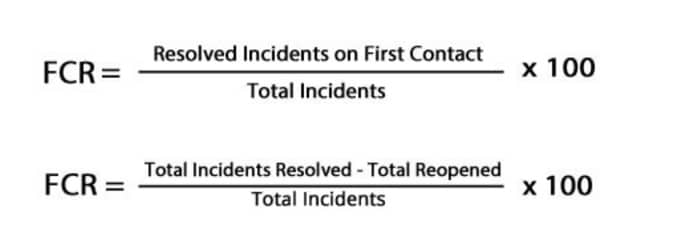
First Contact Resolution Rate
It’s easy to confuse the first contact resolution rate with the overall resolution rate. But these are two different metrics that measure two different things. What makes them more similar is that both of these indicators strongly correlate with customer satisfaction.
The first contact resolution rate is the percentage of customer complaints or issues resolved on the first interaction with the customer. This is one of the metrics that show you the effectiveness of your customer service department.
Although it can show you how a service desk conducts its business, this metric does not apply in situations where a chat or call requires a customer callback.
In situations where the web chats or live calls do not require any callbacks, the customer’s complaint should be resolved before the end of the chat session or before they hang up the phone. A resolution within one business hour of receiving a customer email is regarded as the first contact resolution.
In most cases, customers services teams can any of these two ways to calculate the FCR rate:
But if you don’t want to use any of the above ways of measuring the FCR, you can use follow-up customer satisfaction surveys and ask customers whether their queries were resolved and concluded on the initial contact with the customer service representative.
Ticket Request Volume
Ticket request volume simply refers to the total number of conversations in your customer service inbox.
Luis Hernandez, VP of Customer Success at Geckoboard, believes that’s important to keep track of the ticket request:
Overall, the ticket volume analysis provides a general pulse to the health of your support organization and product.
In other words, good customer service is all about being able to deal with requests quickly –regardless of the number of ticket requests you get.
Receiving a high volume of support tickets can be a telltale sign that there is something wrong about your product. In some cases, it can be an indication that your product has usability issues, or maybe it can be a sign that you need to scale up your support team.
Calculating the ticket request volume is as easy as 1-2-3. All you have to do is compare the amount of support tickets month over month or week over week. Pay particular attention if the number of tickets spikes after a new product or feature release.
Average Ticket Handling Time
Ticket handling time is the average time that an agent spends working on a service desk ticket before escalating or closing the ticket. Alternatively, ticket handling time is an indirect measure of ticket complexity.
What makes this metric more valuable is the fact that it relates to the customer’s most valued commodity: time. Having a short ticket handling time simply means that your customer service team is being more productive and this is something that your customers will like.
The most significant implication of handle time is the impact it has on cost per ticket. As the average handle time increases, the cost per ticket will obviously increase.
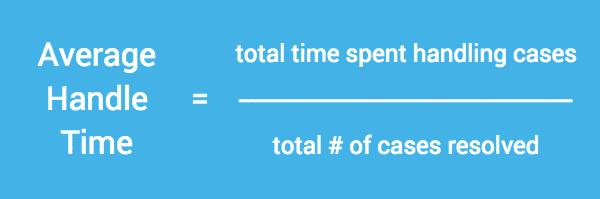
As seen in the image above, you can calculate the average handle time by dividing the total time spent handling tickets and divide it by the total number of tickets resolved.
Now let’s shift focus and look at the most Customer experience metrics:
Customer Satisfaction
As the name implies, customer satisfaction is a metric used to quantify the degree to which a customer is happy with a product, service, or experience. I think of it as a reflection of how a customer feels about interacting with your brand.
What makes this customer satisfaction metric more important is the fact that it helps you identify unsatisfied customers that could churn or leave you negative customer reviews. So it’s safe to say that this metric will help you predict or prevent customer churn, right.
You also need to track this metric so that you identify happy customers that you could act as brand ambassadors. It’s important to always close the loop with a customer if they’re unhappy and fully understand what you could do better to keep their business.
One way of calculating the customer satisfaction metric is by deploying a customer satisfaction survey that asks on a five or seven-point scale how a customer feels about a support interaction –depending on how you have designed your survey, answers can be between “highly unsatisfied” and “highly satisfied” to choose from.
Customer Effort Score
This metric measures how much effort a customer has to exert to get an issue resolved, a request fulfilled, a product purchased/returned or a question answered.
The idea behind this metric is that customers are more loyal to a product or service that is easier to use. So in other terms, the customer effort score measures user experience with a product or service.
Studies have found that reducing the amount of effort a customer has to do to get their problem solved is a higher indicator of customer loyalty than delight.
The customer effort score should be activated in a smart and clever way. We usually recommend that you use it during the following scenarios:
- Immediately after an interaction with a product that led to a purchase or subscription
- Immediately after an interaction with customer service
- To measure the aggregate experience someone has with your product or brand in general
You can quickly improve your customer effort by implementing the following:
- Provide multiple channels for contact/feedback
- Use self-service tools
- Reduce wait times
Positive customer effort scores indicate your product or service is easy-to-use and it has no usability issues. Just like they would with positive reviews, marketing, and sales teams can also use these scores as a differentiator when attracting and engaging leads.
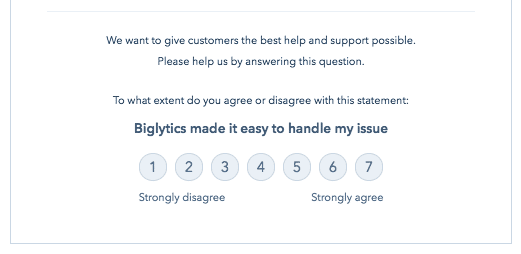
Net Promoter Score
Do you want to measure how loyal your customers are to your brand? Or do you want to measure how likely your customers are to recommend your business to a friend?
Then you have to track the Net Promoter Score. The net promoter score gauges a customer’s overall opinion on a company. You also have to track it if you want to evaluate and improve customer loyalty.
Vinay Patankar, the CEO & Co-Founder of Process Street believe that the Net Promoter Score is a good metric for tracking support quality, he also says:
While this metric also tracks a few other things, low-quality support can cause a low NPS response, and when we get a response and it mentions support in the “why did you choose this number” question we use that as an indicator to investigate the support process.”
If you think about it, the NPS metric acts as an alternative for the customer satisfaction metric. So instead of asking how satisfied a customer is after interacting with your customer service agent, you ask them to gauge the ease of their experience.
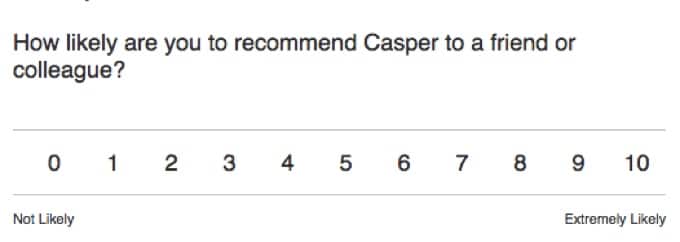
As seen in the image above, the best way of calculating the net promoter score is by surveying your customers and asking them: “On a scale of 0 to 10, how likely are you to recommend to a friend?”
The answers to that question can be categorized into three groups:
- Promoters: Customers who answer the question with 9-10
- Passives: Customers who answer the question with 7-8
- Detractors: Customers who answer the question with 0-6
You can tell that promoters are happy customers who will recommend your brand to friends and family, while passives are those customers who can jump ship and go for an alternative product. As you might have guessed it, detractors are totally unsatisfied and they might give you negative reviews.
Having said that, it’s important to note that Net Promoter Score and Customer Satisfaction metrics are not representative of all of your customers –they only capture the tiny minority of customers who take your survey. In fact, the survey is more likely to capture customers who may have had a highly positive or negative interaction. Plus, in most cases, they will only speak to the interaction they just had.
In other words, the NPS and CSAT do not reflect what customers really think about your brand. It’s just a siloed interaction, and this customer is still very likely to choose your competitor’s products.
Social Media Monitoring
Social media monitoring, sometimes referred to as social listening, is different from all of the metrics we have talked about because it is a practice examining what your customers are saying about you on social media.
So, basically, it consists of a group of metrics that will help you spot concerns and then respond more efficiently. Since it’s a group of metrics, this implies that social media monitoring can take many forms and it can happen on one social network or in several others.
Some of the social media metrics you need to constantly monitor are:
- brand mentions over time
- negative comments
- technical or account questions
- the number of questions that could be answered through other support material
Sometimes it can be difficult to track all the keywords, hashtags and mentions about your brand manually.
Fortunately, there are numerous social media monitoring and management tools – Hootsuite, Hubspot, Boardreader, BuzzSumo, Google Alerts, etc – out there that can tap conversations you won’t find by yourself. Each tool offers a different set of data to help you understand and improve your customer service strategy over time.
Customer Churn Rate
Churn rate, also known as the rate of attrition, is a metric that calculates the number of customers who leave a product over a given period of time. This is one of the vital metrics you need to measure so as to understand how healthy your business is.
Needless to say, for your business to flourish, the number of new customers must be higher than the number of customers who leave.
Churn rate matters because it can suppress your business growth if ignored and if you are able to reduce it by just 5%, you can boost profitability by 75%.
A wide variety of factors may lead to an increase to a churn rate and this makes this metric a bit tricky.
There are a few different ways of calculating the customer churn rate. The easiest way is to take all the customers you lose in one month and divide it by the total number of customers you had at the beginning of the month. Do not include any new sales from that month.
Customer Lifetime Value
Customer Lifetime Value (CLV) is the average amount of money your customers will spend on your business over the entire life of your relationship. This metric might sound so far-fetched, but it matters more than you think. Failure to track it can leave you behind the curve.
The CEO and founder of Kustomer, Brad Birnbaum, believes that:
Customer Lifetime Value is the key metric for customer experience-oriented businesses.
Your customers are not just worth the amount of money they use to buy your products or services today. But if you are able to retain them, they have future value as customers.CLV is important because, the higher the number of customers, the greater the profits.
There are several different ways you can use to calculate CLV. The calculations can either be based on history or predictive of the future. In other terms, CLV may be calculated based on actual purchases over the years or based on what you predict customers will spend in the next couple of years.
Either way, you need to know the average profit margin for purchases, the amount you spend to acquire a customer (customer acquisition cost), and the length of your relationship with customers.
The most common way used to calculate the CLV is the historic model. This model entails that the CLV is equal to the total value of each transaction multiplied by your average gross margin.
Conclusion: Metrics, alone, won’t produce satisfied customers
Once you know the state of your customers, it’s up to you to improve it. This is why Groove’s Melissa Rosen says:
Metrics alone won’t produce satisfied customers. It’s on you to take these data points and build a customer service experience that works for your organization.
The above metrics will only guide you in the right direction. It’s up to you to take these reports and build a customer service experience that works for both your customers and your business. No matter how small your customer service/support team is, measuring from the start of operations will show you how your business and performance is improving over time.


