
Ever stared at a Google Analytics dashboard wondering why people are leaving your site or where they’re getting stuck? Microsoft Clarity might be the missing piece.
It’s a free tool by Microsoft that helps you understand user behavior, including how they move, click, scroll, and become frustrated.
In this guide, we’ll break down what Microsoft Clarity does, how it works, and whether it’s the right tool for your business. We’ll also cover real-world examples, its best features, key limitations, and when you might want to explore CRO alternatives like FigPii.
What Is Microsoft Clarity?
Microsoft Clarity is a free behavioral analytics tool that helps you understand how users interact with your website, visually and in real-time. Unlike Google Analytics, which provides numbers, Clarity shows you what those numbers mean.
With features like session replays, heatmaps, and rage-click detection, you can now tell where users drop and why they do it, helping you make data-driven decisions.
Let’s say you run a D2C skincare site and notice a high bounce rate on your product page. GA4 tells you people are leaving, but it doesn’t tell you why. Clarity helps you watch session recordings and see that users are clicking a “Read More” button expecting ingredients, but it doesn’t expand. That’s a UX gap you can now fix.
Key Features of Microsoft Clarity
Session Recordings: Watch Real Users Navigate Your Site
One of Microsoft Clarity’s most powerful features is session recordings—a real-time playback of how actual users interact with your site.
You can see:
- Cursor movements
- Clicks and scrolls
- Time spent on each section
- Where users hesitate, backtrack, or drop off

Microsoft Clarity session recordings overview (Source)
Unlike traditional analytics, these recordings offer contextual insight into user intent, revealing where users hesitate, what draws their attention, and where they tend to drop off.
Kevin Moore, CMO of WalterWrites.ai, shared a powerful example:
“Clarity flagged repeated frustration on our ‘Start Free 300-Word Trial’ button, even though it technically worked. Session recordings revealed a subtle 1.5-second lag before visual feedback. That short delay was enough to erode trust and tank trial starts.”
Instead of chasing copy tweaks, their team added a quirky loading message—“Just a moment, seasoning your words with human nuances…”—to bridge the gap. The result? Rage clicks vanished, and trial engagement improved.
It’s the kind of issue you’d never catch just by looking at numbers in a dashboard. Without observing how real users interacted, they might have spent weeks rewriting copy when the real problem was a tiny delay that no one had noticed.
This is where Clarity stands out: it shows you what is happening, along with the “why.” And once you understand where users hesitate or disengage, you can test and improve those exact points.
For teams that want to go beyond observation and test new versions of content or layout directly, choose CRO tools like FigPii that offer integrated A/B testing alongside session replay.
However, even as a standalone tool, Clarity’s session recordings can help identify hidden UX issues before they appear in bounce rates.
Heatmaps: Visualize Clicks, Scrolls, And User Attention Zones
Heatmaps in Microsoft Clarity provide a visual overlay of where users click, how far they scroll, and which parts of the page capture their attention.
Instead of making assumptions based on bounce rate or time-on-page, you can see which areas are drawing interaction and which ones are getting ignored.
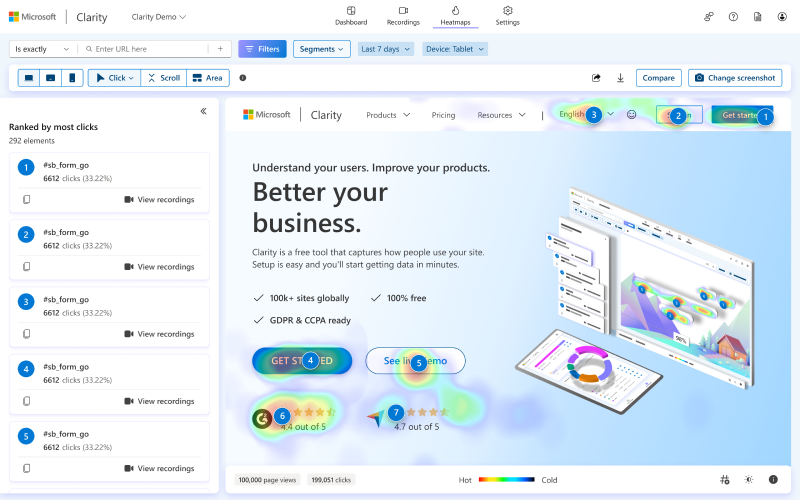
Microsoft Clarity heatmaps (Source)
Phil Portman, CEO of Textdrip, shared how heatmaps exposed blind spots they never caught in standard analytics:
“One moment came when the heatmaps showed people were barely engaging with a section that explained our AI-based texting features, which we thought was a major value-add. It turned out it was buried too far down the page. So, we moved that section up, added a short explainer video, and placed a sticky ‘Try It Now’ button alongside it. That simple change led to a 15% lift in trial signups.”
Heatmaps also help identify design oversights, such as elements that appear clickable but aren’t. Earlier on, Phil’s team discovered that users were rage-clicking on a “Schedule Demo” element that wasn’t even linked. That one fix alone led to a 27% increase in demo requests.
Many users on G2 share the same sentiment: Clarity offers instant visibility into what matters, with one reviewer noting it’s “a free and effective way to see where users interact most—no steep learning curve required.”
The tool may not offer deep funnel analytics or predictive heatmaps like some paid platforms, but for everyday layout and UX optimization, it’s often more than enough.
Rage Clicks and Dead Clicks: Spot Frustration Points
Not every problem on your website or app is obvious.
For example, if a button appears clickable but doesn’t respond immediately, users become confused. They either start clicking repeatedly or give up altogether. These minor issues can quietly kill conversions without you even noticing.
Microsoft Clarity’s Rage Click and Dead Click tracking features help catch exactly that.
Rage clicks, repeated rapid clicks in the same spot—often a sign of user frustration or confusion. Dead clicks highlight areas that users click but that trigger no meaningful response.
These two indicators work best when used in conjunction with session recordings, helping you pinpoint what’s broken from the user’s perspective.
Simon Lee, CEO of Glance, experienced this firsthand during the beta launch of a Gen Z micro-lending app:
“Session recordings showed users repeatedly clicking the ‘Continue’ button in our loan calculator. Rage-click heat glows piled up like campfires. Turns out a hidden animation kept the button disabled for just 320ms, but that tiny delay killed conversions.”
They removed the animation and brought the delay to zero. Loan completion rates jumped within three days. Even more impressively, they tied Clarity’s rage click API to their Slack DevOps: when rage clicks spike above 12 per minute, a deployment lock triggers automatically.
“That real-time guardrail took one afternoon to script and now prevents weekend regressions. Our crash-free sessions rose to 99.3%, and Clarity’s exports slotted straight into our investor pitch deck.”
Ashot Nanayan, CEO of DWI, shared a similar discovery while analyzing bounce rates on a high-traffic product page. His team used Clarity’s rage click detection and session replays and
noticed users repeatedly clicking on the product image, expecting it to zoom or open in a gallery view. The image wasn’t interactive. Once they updated the image behavior to support click-to-zoom (especially on mobile) add-to-cart actions increased by 12%, and the bounce rate significantly dropped.
Heatmaps also helped reposition the page’s CTA higher, improving click-through rates on key category pages.
Here’s a simulated heatmap snapshot used during that review. It clearly shows user behavior across different zones of the product page:

A Clarity project heatmap showing users repeatedly clicking on a product image that doesn’t zoom, revealing a clear UX issue that needed fixing.
JavaScript Error Tracking: See Where Scripts Break User Flow
Sometimes your site looks fine, but something breaks in the background and users get stuck. A button doesn’t work, a form won’t submit, or a feature just doesn’t load. JavaScript errors are often the culprit behind these issues, and they’re easy to miss if you’re not checking your browser console regularly.
Microsoft Clarity helps by automatically flagging these errors and linking them to real user sessions. That means you can watch exactly what went wrong, where, and for whom.
For example, if a script fails to load on older Android devices, you can filter session recordings by JavaScript errors and see how it affects user behavior.
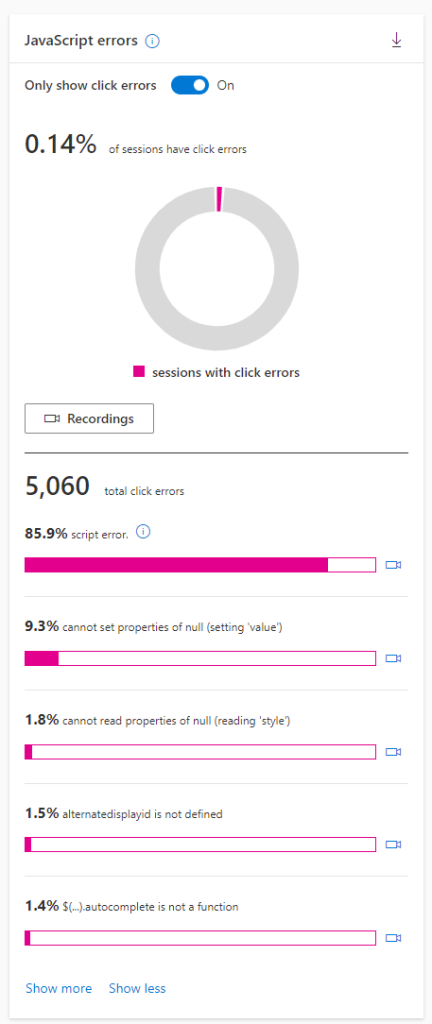
Microsoft Clarity JavaScript error feature (Source)
Instead of digging through logs, Clarity shows you the issue in context, so you can fix it faster and avoid confusing your users.
Filters and Segments: Analyze Specific User Groups or Behaviors
One of the most powerful (and underrated) features in Microsoft Clarity is how easily you can filter your data and save those filters as reusable segments. Whether you’re reviewing heatmaps, session recordings, or dashboard trends, these filters help you drill down to the exact group of users you want to understand.
Let’s say you only want to view session recordings of mobile users who came from organic search in the last 30 days. Instead of sorting manually, you can apply those conditions using Clarity’s filters and save them as a custom segment. From then on, that same group is one click away—no need to repeat the setup.
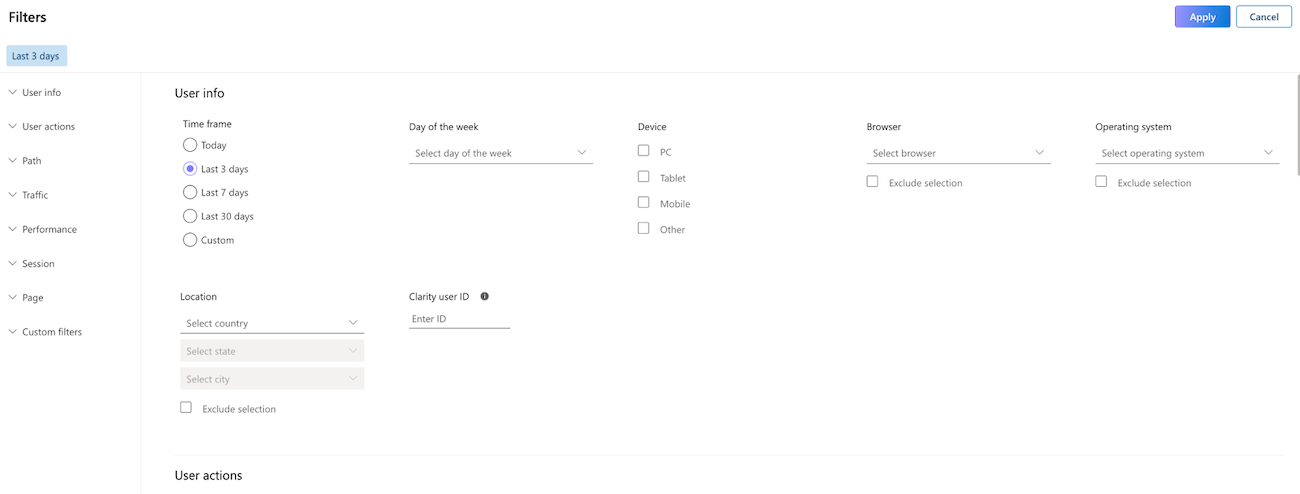
Microsoft Clarity filtering and segmentation (Source)
You can filter data by a wide range of conditions, including:
- User info: Break down users by device, location, or time of visit. Helpful when analyzing mobile vs. desktop behavior or identifying issues tied to a specific region.
- User actions: See what people did, including rage clicks, scroll depth, or user interactions with specific buttons or text. If you’ve set up smart events, such as purchases or form submissions, you can also filter by those. Publishers can even filter by how much of an article a user has read.
- Path: Track the pages users visited in a session. You can include or exclude specific URLs, or create more complex rules using regular expressions (regex).
- Traffic: Filter by how people arrived on your site (via referrals, UTM tags, or campaign sources), helping you analyze user behavior by channel.
- Performance: Split users based on their experience with site speed. This is helpful if you suspect slow load times are hurting conversions.
- Session: Available within session recordings and dashboards, this feature allows you to filter by time on site, number of clicks, or page views per session.
- Page: Zoom in on behavior tied to a single page, such as the duration users stayed, the amount of interaction, or whether any errors occurred.
Clarity also allows you to set up custom filters and segment your audience better.
If you use Google Tag Manager or Clarity’s API, you can add tags like user IDs or specific actions. This gives you nearly unlimited ways to segment your users and analyze results more precisely.
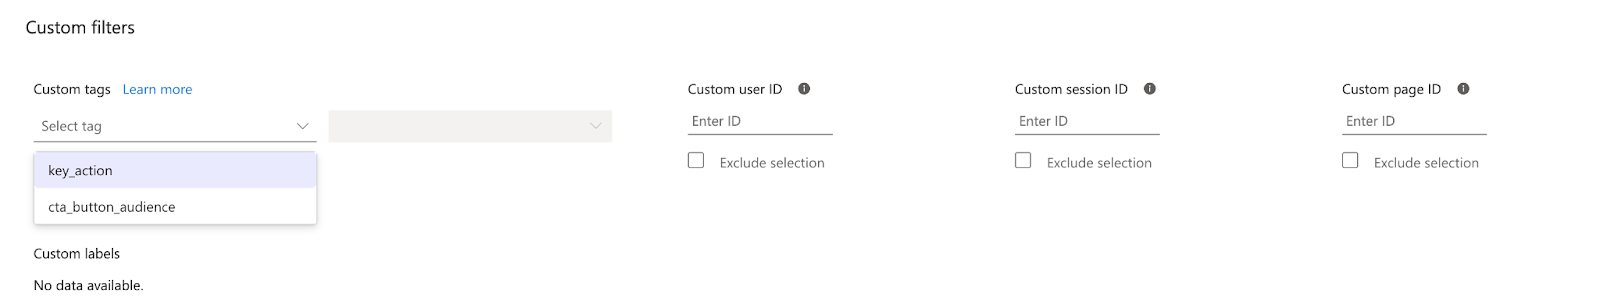
Microsoft Clarity custom tags for filtering and segmentation (Source)
Once you apply filters, you can use them across Clarity—on session replays, heatmaps, or dashboards. If it’s a view you’ll revisit, just save it as a segment. For example: “Mobile Organic Users – Last 30 Days”. The next time you want to explore that user group, it’s ready in one click.
Why Microsoft Clarity is Important
Microsoft Clarity gives you real answers to what’s working—and what’s not—on your site. Here’s why it matters:
- It uncovers UX issues. You can quickly see where users are dropping off, getting confused, or clicking in the wrong place—all of which are important for user retention. For example, let’s say users keep missing a call-to-action or get stuck on a form. Clarity’s session recordings and rage click alerts will show you exactly where and why.
- Improves Conversion Rate Optimization (CRO). Instead of guessing why a page isn’t converting, Clarity helps you test your ideas with real user behavior. You can watch how people interact with your page and see what needs fixing—whether it’s copy, layout, or load time.
- Make better SEO and content decisions. Heatmaps and scroll tracking reveal how far people read, where they tend to pause, and what they tend to skip. This helps you improve readability, reposition content, or adjust internal linking based on how users move through your site.
- Microsoft Clarity has no cost barrier. Clarity is entirely free, with unlimited heatmaps and session recordings. That makes it accessible even for small teams or early-stage businesses, without sacrificing useful features.
Clarity’s Limitations (and When to Explore Alternatives):
Clarity is excellent for watching how people use your site, but it’s not built for everything.
It doesn’t include built-in A/B testing, form analytics, or on-page surveys. So if you’re trying to test two versions of a headline or create website polls to ask users why they didn’t convert, you’ll need something more.
If you’re looking for a tool that combines recordings, heatmaps, A/B tests, and surveys all in one, you might want to explore alternatives like FigPii—an all-in-one CRO tool. It’s a good next step if you’re ready to go from watching problems to actively testing solutions.
Clarity gives you the “what” and “where.” Tools like FigPii help you figure out the “why” and test the “what if.”
Final Verdict: Who Should Use It
Microsoft Clarity is great if you want a simple, no-cost way to see how users interact with your site. It’s handy for CRO experts who want quick, visual insights without needing a developer to set things up. Clarity’s Microsoft connection also makes it a reliable choice.
If you’re just starting with UX or CRO, Clarity gives you everything you need to catch obvious issues. This includes rage clicks, broken flows, and ignored CTAs. For small teams, content-heavy sites, or early-stage businesses, it’s an ideal first tool.
However, if you’re scaling your optimization efforts and need more than just observation—such as A/B testing, feedback polls, or detailed form analytics—you may eventually outgrow it. At that point, platforms like FigPii can help take you further, offering a more complete CRO toolkit with testing and user feedback baked in.
Microsoft Clarity FAQs
Is Microsoft Clarity really free?
Yes, Microsoft Clarity is completely free—no trial limits, no paid upgrades, and no usage caps. You get unlimited session recordings, heatmaps, and insights without needing to enter a credit card.
Will Microsoft Clarity slow down my website?
No, Clarity is lightweight and non-blocking. It loads asynchronously, meaning it doesn’t interfere with your site’s speed or user experience. Most users report zero noticeable performance impact.
Can I use Microsoft Clarity with GA4?
Yes, Clarity works well alongside Google Analytics 4 (GA4). You can even integrate the two, so GA4 session IDs appear inside Clarity. This makes it easier to connect behavior insights with your analytics data for a fuller picture.


