
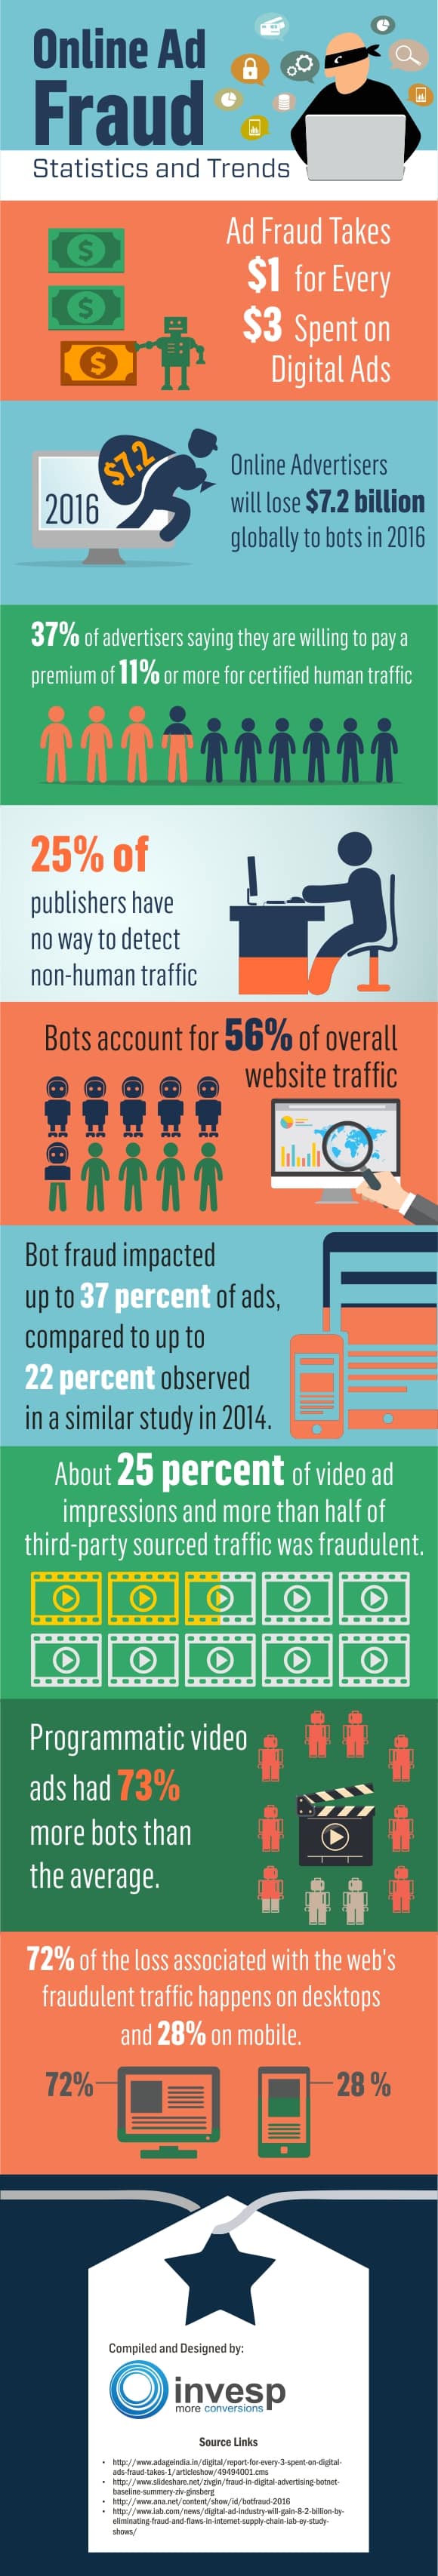
Did you know digital ad fraud takes $1 for every $3 spent on digital ads and online advertisers are estimated to loss $7.2 Billion globally to bots in 2016. 37% of advertisers surveyed are ready to pay a premium of 11% or more for certified human traffic. Check out our infographic on Digital ad fraud for latest statistics and trends.
Infographic by- Invesp Landing Page Optimization Company
To Publish this Image on your Blog or Website . Copy this code
Bots account for 56% of overall website traffic and 25% of publishers have no way to detect non-human traffic. 72% of the loss associated with the web’s fraudulent traffic happens on desktops and 28 percent on mobile.
Bot fraud impacted up to 37 percent of ads, compared to up to 22 percent observed in a similar study in 2014. Programmatic video ads had 73 percent more bots than the average. About 25 percent of video ad impressions and more than half of third-party sourced traffic was fraudulent.


