


A/B testing statistics can often seem overwhelming, but they are essential for making informed decisions.
“Why do I need to learn about statistics to run an A/B test?” you may wonder, especially since the testing engine provides data to judge the statistical significance of the test, right?
In fact, there are plenty of reasons to learn statistics.
If you’re conducting A/B tests, you need a basic understanding of statistics to validate your tests and their results.
Nobody wants to waste time, money, and effort on something useless. To use A/B testing efficiently and effectively, you must understand it and the statistics behind it.
Statistical hypothesis testing is at the core of A/B testing. Sounds exciting, huh?
No worries, you won’t be grinding through statistics and calculations—this is all done automatically. However, you should know the key concepts and how to interpret test results to make them meaningful.
Let’s start by exploring some of the basics.
A/B Testing Key Terminology
1. Variants (Control & Treatment)
In A/B testing, “variants” are the two versions of something you’re testing.
These are usually called Control and Treatment:
- Control: This is the original version. It’s your current use (e.g., your existing webpage, ad, or email).
- Treatment: This is the new version you’re testing against the control. It has some changes (like a different headline, color, or button placement).
Pro tip: Always ensure your Control and Treatment differ by just one element. That way, you can identify what caused any change in performance.
2. Hypothesis
When conducting a test, you assume a population parameter and a numerical value. This is your hypothesis (it corresponds to Step 9 of the conversion optimization system).
In a simplified example, your hypothesis could look like this:
“Changing the color of the ‘Buy Now’ button from blue to green will increase purchases by 10% because green grabs more attention.”
This is your hypothesis in “normal words.” But what would it look like in statistics?
In statistics, your hypothesis breaks down into:
- Null hypothesis: The null hypothesis states the default position to be tested or the situation as it is (assumed to be) now, i.e., the status quo.
- Alternative hypothesis: The alternative hypothesis challenges the status quo (the null hypothesis) and is a hypothesis that the researcher (you) believes to be true. The alternative hypothesis is what you might hope your A/B test will prove accurate.
Let’s look at an example:
The conversion rate on Acme. Inc.’s product pages are 8%. One problem they revealed during the heuristic evaluation was that there were simply no product reviews on the product pages. They believe that adding reviews would help visitors decide, thereby increasing traffic to the cart page and conversions.
The null hypothesis here would be: no reviews generate a conversion rate equal to 8% (the status quo)
The alternative hypothesis here is that adding reviews will increase the conversion rates to more than 8%.
Now, you, the researcher, must collect enough evidence to reject the null hypothesis and prove that the alternative hypothesis is true.
3. Conversion rate
The conversion rate is the percentage of people who complete your desired action, like making a purchase, signing up for a newsletter, or clicking a button.
Formula:
Conversion Rate = (Number of conversions / Number of total visitors) × 100
For example, you run an online store, and 100 people visit your website daily. If ten people make a purchase, your conversion rate is 10%.
Conversion rate is the key metric you’ll look at to decide whether your Control or Treatment performed better.
4. A/B Testing Errors
In hypothesis testing (A/B testing), there are three possible outcomes:
- No error: The test results are correct.
- Type I error: Occurs when you incorrectly reject the null hypothesis, concluding there’s a difference between the original and the variation when there isn’t. This results in false positives, where you think a variation is a winner when it’s not. Type I errors often occur when tests are stopped too early, before sufficient data is collected.
- Type II error: Occurs when you fail to reject the null hypothesis, leading to false negative results. You conclude that none of the variations beat the original when, in reality, one did.
Type I and type II errors cannot happen at the same time:
- Type I error occurs only when the null hypothesis is true
- Type II error occurs only when the hypothesis is false
Keep in mind that statistical errors are unavoidable.
However, the more you know how to quantify them, the more accurate your results will be. When conducting hypothesis testing, you cannot “100%” prove anything, but you can get statistically significant results.
Setting Up an A/B Test
Defining Goals
The first step in any A/B test is to clearly define your goal. What do you want to improve or learn? This could increase conversions on your website, improve click-through rates in an email campaign, or boost user engagement in an app.
The goal should be specific, measurable, and aligned with your business objectives.
Pro tip: Make sure everyone on the team agrees on the goal. The results will be hard to interpret if your goal is unclear or too broad. Stick to one primary metric for each test.
Choosing Metrics
Once you’ve set a goal, pick the right metric(s) to measure success. Your metrics should directly reflect the goal. For example, if your goal is increasing purchases, the primary metric might be the conversion rate. Secondary metrics, like average order value, can provide additional insights.
Pro tip: Always connect your metric to your business’s bottom line. If the metric doesn’t improve your business, it’s not worth tracking.
Sample Size Calculation
For your A/B test to be valid, you need enough data to say confidently whether one version performed better than the other.
This is where the sample size comes in.
If a sample is too small, your results might be skewed. Too large, and you’re wasting time and resources. The goal is to find the sweet spot.
A standard sample size formula considers your baseline conversion rate, desired lift (the improvement you expect), and the statistical significance level. Online tools like FigPii’s Sample Size Calculator make this easy.

Pro tip: Don’t stop the test early! Even if one variant appears to be the winner after a few days, you need the full sample size to ensure the result isn’t just due to chance. Let the test run until the data is complete.
How to Run an A/B Test?
To better understand A/B stats, we need to scale back to the beginning.
A/B testing refers to experiments in which two or more variations of the same webpage are compared by displaying them to real-time visitors to determine which performs better for a given goal. A/B testing is not limited to web pages; you can A/B test your emails, pop-ups, sign-up forms, apps, and more.
Nowadays, most MarTech software comes with built-in A/B testing functionality.
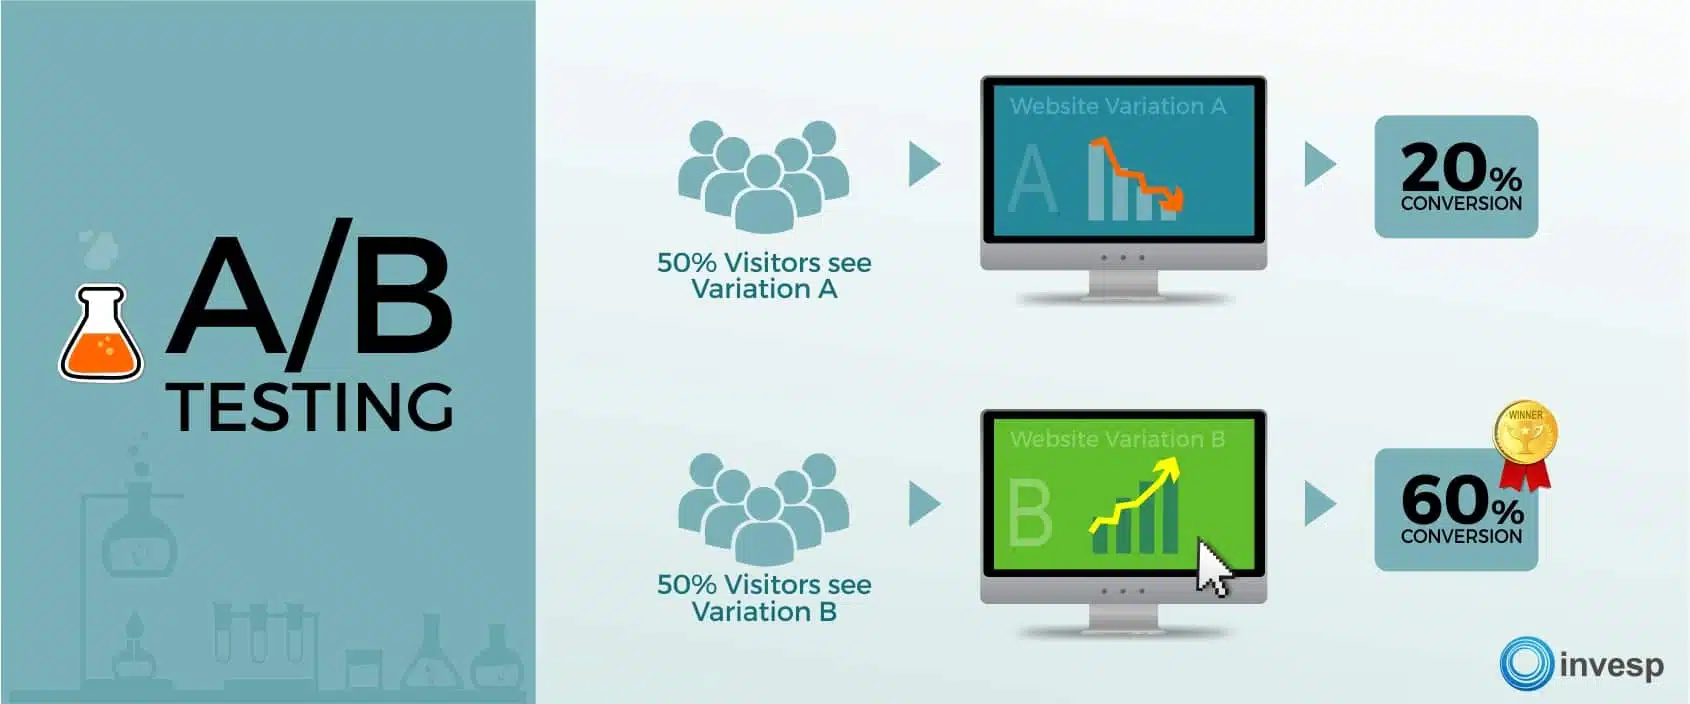
Executing an A/B test becomes simple when you know precisely what you are testing and why.
We discussed in detail our 12-step CRO process that can guide you when starting an A/B testing program:
- Conduct heuristic analysis
- Conduct qualitative analysis, including heatmaps, polls, surveys, and user testing.
- Conduct quantitative analysis of your website analytics to identify which pages are leaking visitors.
- Conduct competitive analysis
- Gather all data to determine problem areas on the site
- Analyze the problems through the Conversion Framework
- Prioritize the problems on the website
- Create a conversion roadmap
- Create a test hypothesis
- Create new designs
- Conduct A/B Testing
- Conduct Post-Test Analysis
Editor’s Note: Download this free guide to learn more about the essentials of multivariate and A/B testing.
What Should You Know to Avoid Statistical Errors?
Random Sampling
A/B testing derives its power from random sampling.
When we conduct an A/B test (or multivariate test), we randomly distribute visitors among different variations. We use the results for each variation to judge how that variation will behave if it is the only design visitors see.
Let’s consider an example.
You run an A/B test on a website, comparing two call-to-action buttons:
- Original button conversion rate – 5%
- Variation button conversion rate – 8%
During testing, only some visitors saw the original button, which resulted in a 5% conversion rate. The other portion saw the variation button, which showed an 8% conversion rate.
Now, you’re tempted to declare the variation button the winner. But will the conversion rate hold if you direct all visitors to the variation button?
The data alone isn’t enough to draw a conclusion.
As the test runs, we record the sample distribution for each variation. We need to assess whether the difference in conversion rates is due to random chance or reflects an actual performance difference. To confirm this, we must ensure the results are statistically significant and not influenced by chance.
Confidence Level
In different A/B testing software packages, you may see a column called:
- Confidence
- Statistical significance
- Significance
It usually shows a percentage between 0 and 100% and indicates how statistically significant the results are.
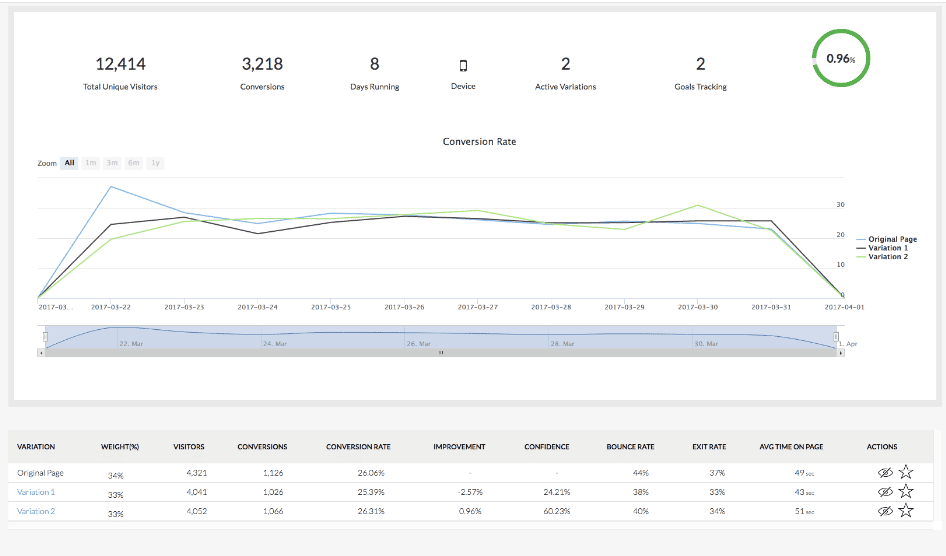
What does it all mean?
Level of significance, or α, is the probability of wrongly acknowledging that the variation produces an increase in conversions. Thus, the confidence level is 100%*(1-α) (we made this note for those who may have a question about it).
In other words, the confidence level is 100% minus the level of significance (1%, 5%, or 10%), resulting in 90%, 95%, or 99%.
This is the number you usually see in your testing engine.
If you see a confidence level of 95%, does it mean that the test results are 95% accurate? Does it mean that there is a 95% probability that the test is accurate? Not really.
There are two ways to think of confidence level:
- It means that if you repeat this test over and over again, the results will match the initial test in 95% of cases.
- It means that you are confident that 5% of your test samples will choose the original page over the challenger.
Since we are dealing with confidence levels for a statistical sample, you are better off thinking that the higher the confidence level, the more confident you are in your results.
What affects the confidence level of your test?
- Test sample size: the number of visitors participating in the test.
- Variability of results: the extent to which test data points vary from the average, mean, or each other.
Let’s see how it happens.
Confidence Interval
In some A/B testing software, you see the conversion percentage as a range or interval.

It could also look like this:
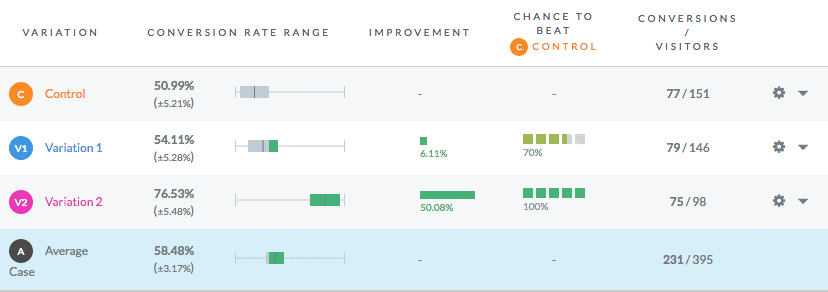
Why are these ranges, or intervals, needed?
This is the “width” of the confidence level, called the confidence interval. It indicates the level of certainty of the results.
When we combine the confidence interval and confidence level, we get the conversion rate as a range of percentages.
The single conversion rate percentage you calculate for a variation is a point estimate based on a random sample from the population. When we conduct an A/B test, we aim to estimate the population mean conversion rate.
The point estimate doesn’t provide a very accurate picture of all your website visitors. The confidence interval provides a range of values for the conversion rate (the point that is likely to contain the actual conversion rate of the population).
The interval provides you with more accurate information about all the visitors to your website (the population) because it accounts for sampling error (don’t mix it up with errors I and II above). It also says how close the results are to the point estimate.
In the example from the VWO interface, the confidence interval is shown as ± the point estimate. This ± number reflects the margin of error. It defines the relationship between population parameters and sample statistics (how the results you got during the test would apply to all your website visitors).
What margin of error is good?
The lower the margin of error, the better. It means that the result you get for the A/B test (a sample of your website visitors) is close enough to the result you would get for all your website visitors.
We would say that a margin of error of less than 5% is good.
The margin of error is affected by the sample size. Below, you can see how it changes with sample size.
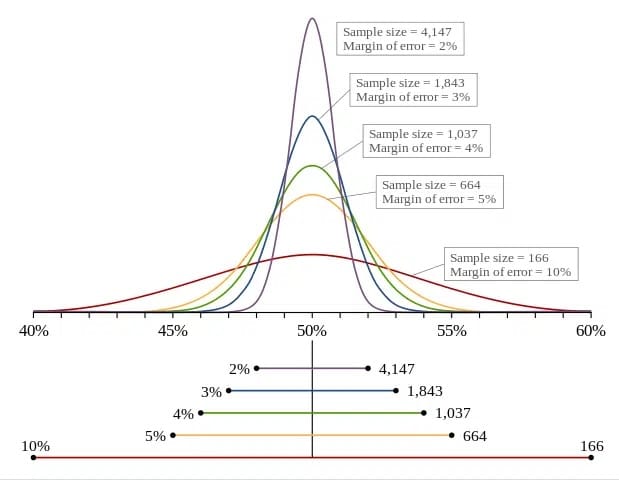
The bigger your sample size, the lower your margin of error.
Frequentist vs. Bayesian Approach to A/B Testing
Confidence levels and confidence intervals, which we discussed above, are part of the frequentist approach to A/B testing.
However, some testing engines (VWO or Google Experiments) use Bayesian probabilities to evaluate A/B test results.
Frequentist and Bayesian reasoning are two different approaches to analyzing statistical data and making decisions based on it.
They have a different view on a number of statistical issues:
- Probability. Frequentist probability defines the relative frequency with which an event occurs (e.g., a 95% confidence level means that if you repeat the experiment many times, you expect the same result in 95% of cases). Bayesian probability measures the strength of your belief about the true state of affairs, aligning more closely with the usual definition of probability.
- Reasoning. Frequentist reasoning uses deduction: if the population looks like this, my sample might look like this. Bayesian reasoning uses induction: if my sample looks like this, the true situation might be like this.
- Data. Frequentists believe that population parameters are fixed and studies are repeatable. They treat experiment data as self-contained and do not use data from previous experiments. Bayesians view sample data as fixed, while population data is random and described through probability, incorporating prior probabilities (pre-existing beliefs) in their analysis.
Is one reasoning better than the other?
There is a heated debate about it.
However, when you use one or another A/B testing tool, you should be aware of what reasoning the tool uses so that you can interpret the results correctly.
- Frequentist A/B testing shows you (at a given confidence level) the percentage of all possible samples that can be expected to include the result you got (challenger beating control).
- Bayesian A/B testing gives you an actual probability of the challenger beating the control.
And none of these reasoning methods can make you safe from A/B testing mistakes.
How Should You Treat the Data You Get Through A/B Testing?
To sum it up for you, when you get some A/B testing results, you should check the following:
- Sample Size per Variation: Ensure the sample size is sufficient. Small sample sizes yield unreliable results.
- Number of Conversions: A minimum of 100 conversions is needed, but 200- 300 is better. Larger websites should not consider data until there are at least 1,000 conversions for each variation.
- Test Duration: Ensure the test runs for at least one full week to account for variability and avoid biases from short-term fluctuations. Consider seasonal factors and marketing efforts that might affect results.
- Confidence Level: A 95% confidence interval is standard, but ensure the test meets the sample size and duration requirements before drawing conclusions. Only stop the test if it reaches 95% confidence and satisfies the sample size and duration criteria.
- Margin of Error: Check the margin of error if provided by your testing engine. A smaller margin indicates more accurate results.
Why should you check all these things? A/B test is an experiment. For an experiment to be considered successful from a scientific point of view, it should meet certain criteria.
You should also always remember that:
- Randomness is a part of your test, and there are a number of statistical values that affect it.
- A/B testing is a decision-making method, but it cannot give you a 100% accurate prediction of your visitors’ behavior.
As Hayan Huang, from the University of California, Berkley, points out:
Statistics derives its power from random sampling. The argument is that random sampling will average out the differences between two populations and the differences between the populations seen post “treatment” could be easily traceable as a result of the treatment only. Obviously, life isn’t as simple. There is little chance that one will pick random samples that result in significantly same populations. Even if they are the same populations, we can’t be sure whether the results that we are seeing are just one time (or rare) events or actually significant (regularly occurring) events.
Over to You!
When running A/B tests, remember that they are, in essence, statistical hypothesis testing. So, it would be best if you stuck to statistical principles to get valid results.
Also, keep in mind that running an A/B test provides insights into how changes to your website design or messaging affect the conversion rate. The post-test analysis will give you the directions for implementing the changes to your website.