A successful website is one that converts. However, converting potential customers is not an easy feat.
After all, you only have about a few seconds to make a first impression. Most visitors take merely seven seconds to decide whether they want to stay on your site or not.
That’s why analyzing how users interact with your site is a primary concern of marketers today.
As a result, heat map & user insights software are slowly becoming the next big thing for digital marketers.
A heat map is a visual representation of where your users click, hover or scroll on your website. It helps you discover what’s working and what’s not. That way, you can fine-tune your content and features to fit what users want them to be.
The more user data you have on hand, the better decisions you can make when it comes to digital marketing.
For so many years, Hotjar dominated the market.
But there are many alternatives available these days. Some of them even offer more additional functions (for example, A/B testing) than Hotjar.
Another problem is that some of Hotjar’s plans come with a hefty price tag. On the other hand, you’ll find many alternatives offering a better deal.
So if you are looking for a Hotjar alternative that doesn’t break the bank, read on!
Hotjar Overview.
Digital marketers often use Hotjar for heat map and conversion monitoring.
It’s a user behavior analytics, website optimization, and heat mapping tool for websites. You can use it to: see precisely what people are doing on your website, find out why they are not completing tasks, get feedback, and make changes to your website based on visitor analytics.
Taking a poll? Running an exit survey? Building a Customer Journey Map? Creating a user feedback forum?
Hotjar’s web analytics tools let you do all of that and more.
Here are some of the key Hotjar features:
- Heat Maps (click map, move map, scroll map)
- Form and form field engagement analysis.
- Visitor recording.
- Filter and segment recordings and heat maps.
- Custom tagging.
- View user actions and take notes.
- Conversion funnels.
- Feedback polls and surveys (with multiple question types, including NPS).
- Instant feedback on websites and apps.
But not every platform can be one-size-fits-all.
That’s why today we’re going to talk about some of the top Hotjar alternatives so that you have more options while looking for a heat map and website optimization software tool that aligns with your requirements.
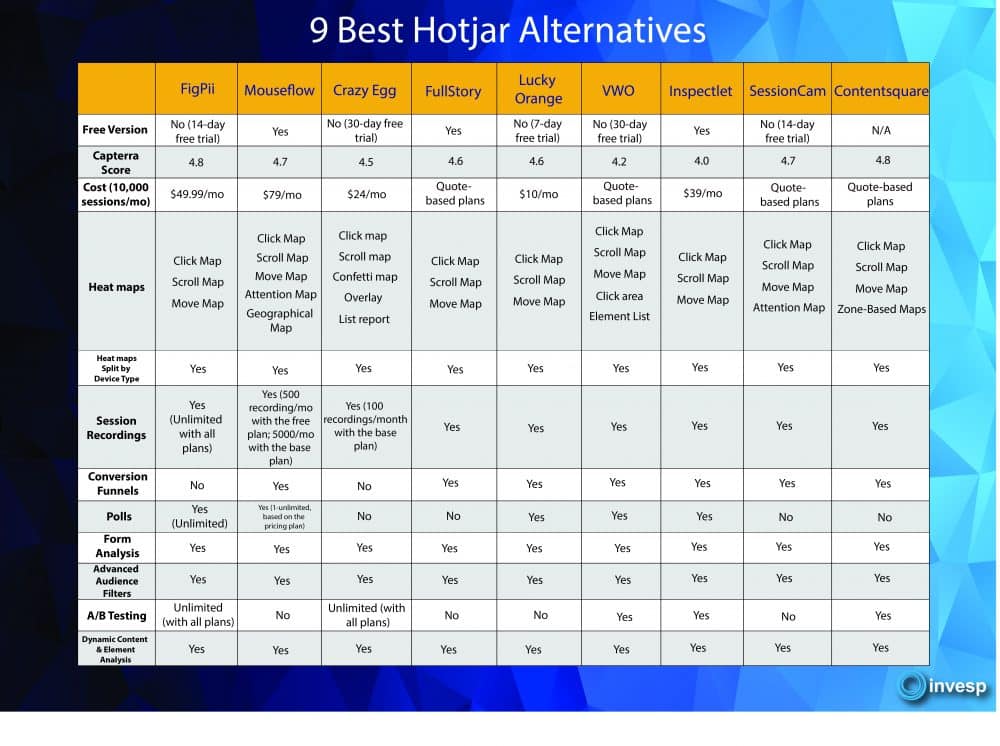
Hotjar Alternatives Comparison Table.
In a hurry? Here’s a quick breakdown and side-by-side comparison of all the Hotjar alternatives:
What Are The Best Hotjar Alternatives?
Here are my top picks for the best Hotjar alternatives:
1. FigPii
Best overall Hotjar alternative.
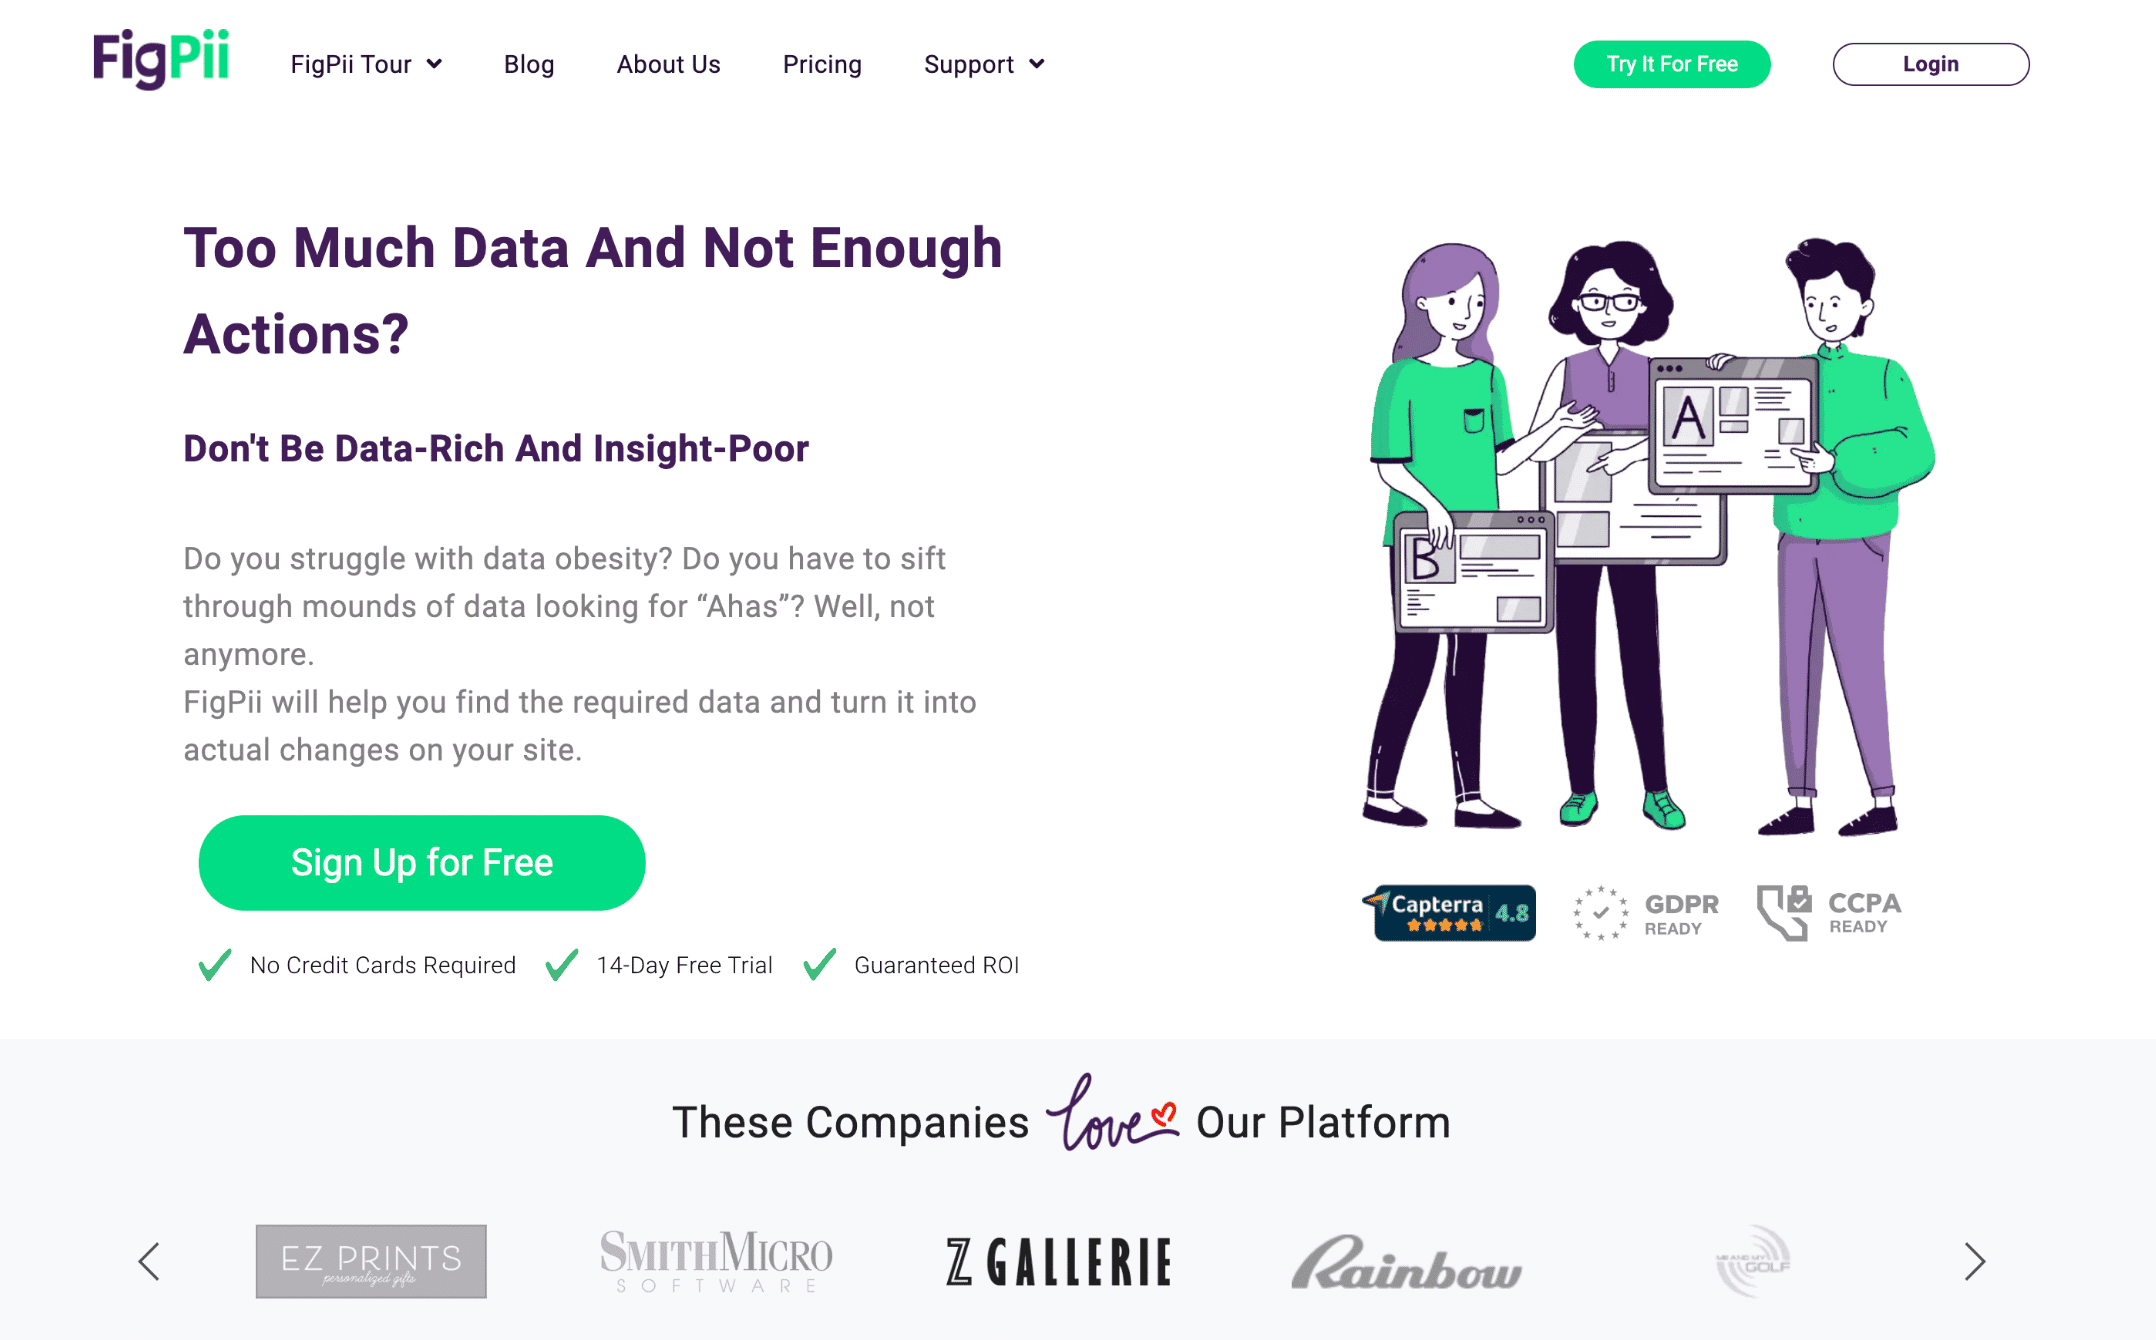
FigPii is an all-in-one conversion rate optimization platform that gives you a complete idea of how users behave on your site.
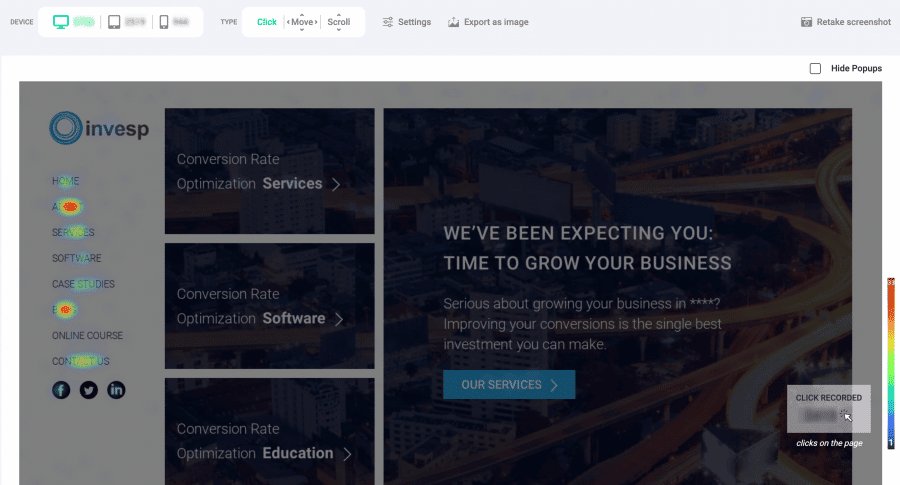
For one, they help you eliminate the guesswork with their heat maps and session recordings. They have scroll maps, click maps, and regular heat maps that you can segment based on the devices (smartphone, tablet, desktop) used by visitors to visit your site.
The session recording feature lets you watch entire videos that give you a clear picture of how users move around your website – from the beginning to the end.
Not just that, you can filter the sessions by attributes like user type, country, device, duration, and more. And you can even add custom tags (up to 5 tags) to the sessions to segment them based on custom attributes.
Next, you get the polling feature to get a direct user opinion. The ability to run polls using different question types (rating-based polls, checkbox, short text, long text, select box, etc.) is another bonus.
The best part? FigPii lets you target polls towards specific segments and campaigns. This means you can choose to display your poll to a narrowly targeted audience at a specific time.
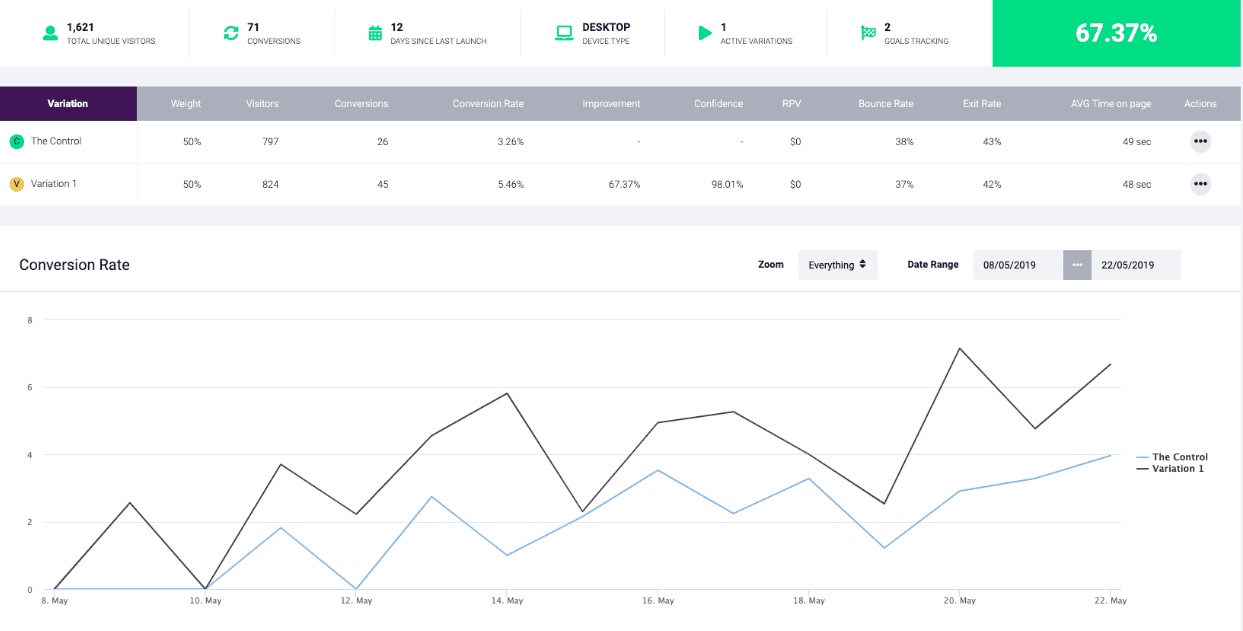
Finally, you can analyze all the data through visual representation of metrics like total unique visitors and conversion rate.
So far, so good.
Now, what makes FigPii stand out is the ability to run A/B tests and split URL tests. Creating variants to test is also simple with their WYSIWYG (What You See Is What You Get) editor.
Their impressive customer support is also worth mentioning. You can always reach out to their team via:
- Email/Help desk
- Phone Support
- 24/7 (Live rep)
You’d also be glad to know that FigPii allows unlimited users. This means pricing plans won’t vary based on the number of users browsing your site.
Pricing Plans:
FigPii offers four pricing plans:
- Starter ($49.99/month) – 10,000 visitors per month, unlimited heat maps, unlimited session recordings, unlimited polls, and an unlimited number of users.
- Small ($99.99/month) – All features in the Starter plan + 30,000 visitors per month.
- Medium ($199.99/month) – All features in the Small plan + 60,000 visitors per month.
- Large ($339.99/month) – All features in the Medium plan + 100,000 visitors per month.
They also offer a 14-day free trial with all their plans, and the tool integrates well with Google Analytics.
2. Mouseflow
Best for building and monitoring entire conversion funnels.
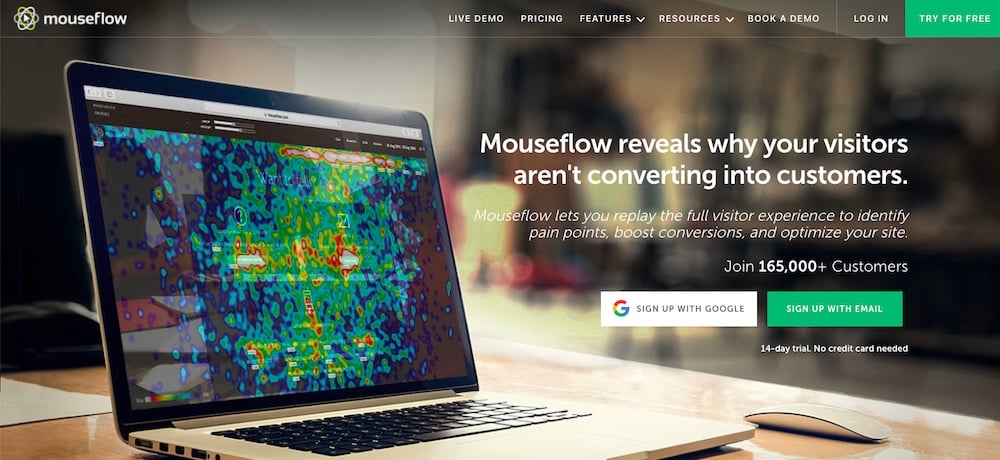
Being able to collect user feedback is essential to help grow and improve your business. With Mouseflow, you will be able to collect, organize, and analyze customer feedback in real-time.
At a glance, it’s not too different from Hotjar. Just like Hotjar, Mouseflow has heat maps, feedback forms, session replays, and conversion funnels.
But they offer five types of heatmaps, not just the standard ones (click maps, scroll maps, movement heat maps).
First, there are the standard heat map tools that allow you to see where people are clicking, how far they scroll, the average bounce rate of your pages, and much more.
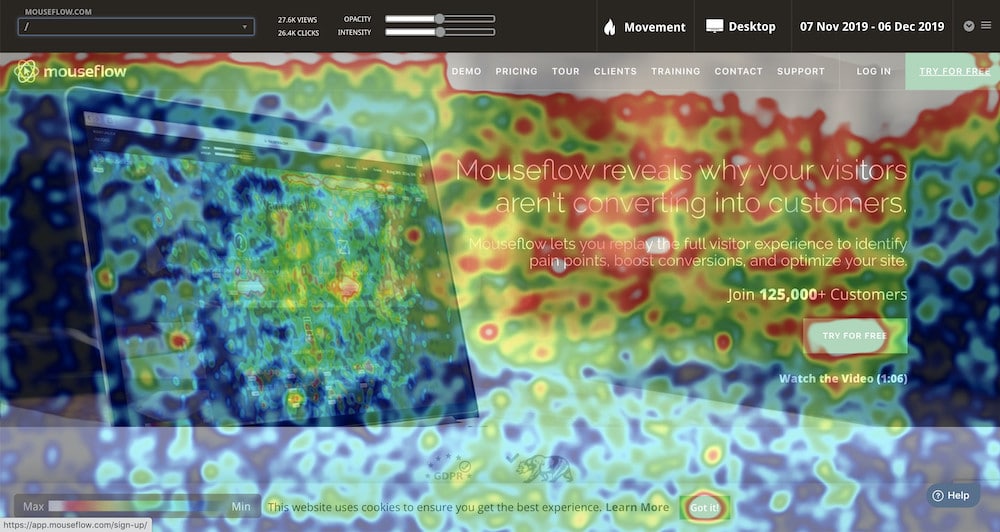
In addition, they have:
- Attention heat map – The attention heatmap helps you analyze how long a visitor spends on your site and what part/content holds the most attention.
- Geographical heat map – As the name suggests, the geographical heat map shows how many users are visiting your site from which location.
Then there’s a standard yet robust session replay that works like CCTV footage. It also allows cross-device tracking (mobile phones, tabs, and desktop) and even tracks dynamic elements (drop-down menus, pop-ups, etc.).
You can also segment visitors in heat map analysis as well as session replays by location, platform, source, operating system, and more.
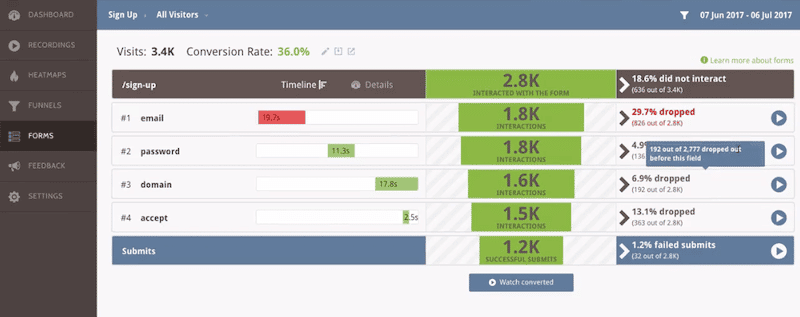
Mouseflow also comes with a separate form analysis feature that lets you determine how visitors interact with forms on your site. Rage clicks, drop-offs, refills, errors, etc., the built-in form analysis function gives an insight into every action taken by the visitor.
There’s no built-in A/B testing feature, however. So, if you’re looking for an analysis and user insight tool that comes with the split testing function as well, then Mouseflow isn’t for you. They do allow native integration with A/B testing tools like Optimizely, though.
Other key features include the ability to build, monitor, and optimize entire user journeys from a single dashboard and run custom surveys to target specific audiences.
Pricing Plans:
Mouseflow has five paid plans and one free plan:
- Free – Unlimited heat maps, unlimited events, 500 sessions/mo, 1 funnel report, 1 feedback survey, 1 form analytics.
- Starter ($24/month paid annually) – Unlimited heat maps, unlimited events, 5,000 sessions/mo, 3 funnel reports, 3 feedback surveys, 3 form analytics.
- Growth ($79/month paid annually) – Everything in the Starter plan + 15,000 sessions/mo, 10 funnel reports, 10 feedback surveys, 10 form analytics.
- Business ($159/month paid annually) – Everything in the Growth plan + 50,000 sessions/mo, 20 funnel reports, 20 feedback surveys, 20 form analytics.
- Pro ($299/month paid annually) – Everything in the Business plan + 150,000 sessions/mo, 30 funnel reports, 30 feedback surveys, 30 form analytics.
- Enterprise (Quote-based plan for larger enterprises) – Everything in the Pro plan + over 200,000 sessions/mo, unlimited funnel reports, unlimited feedback surveys, and unlimited form analytics.
They also provide phone support and 2-factor authentication with all their plans (even with the free plan).
3. Crazy Egg
Best website optimization tool for startups, small businesses, and freelancers.
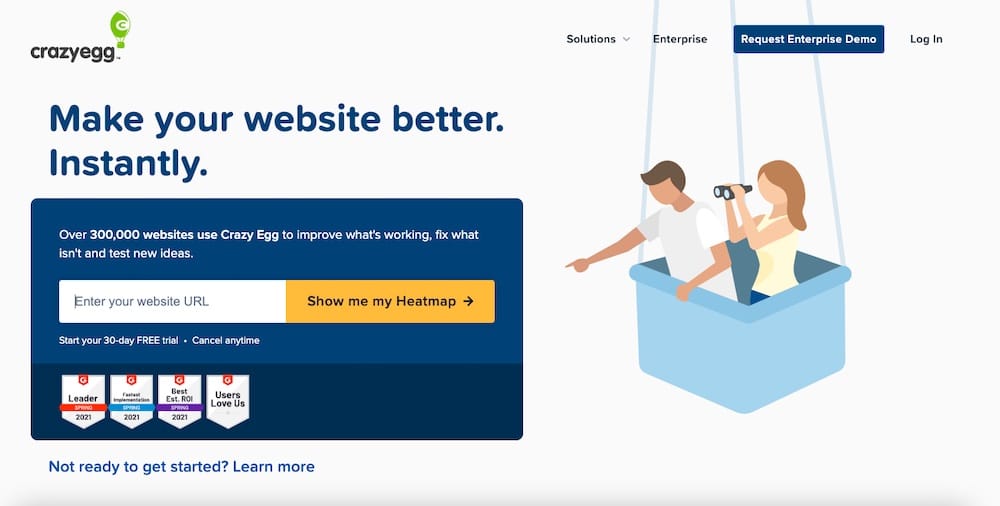
Crazy Egg is a feature-rich, easy-to-use, and affordable heat map software that can be used in various ways on your website.
The software comes with five types of heat maps (or snapshots, as they call them). One snapshot displays five types of reports: heat map, scroll map, confetti report, overlay report, and list report.
The Confetti Report displays precise clicks on a page from your visitors and the metrics for the clicks. The colorful confetti dots each represent a click on the page.
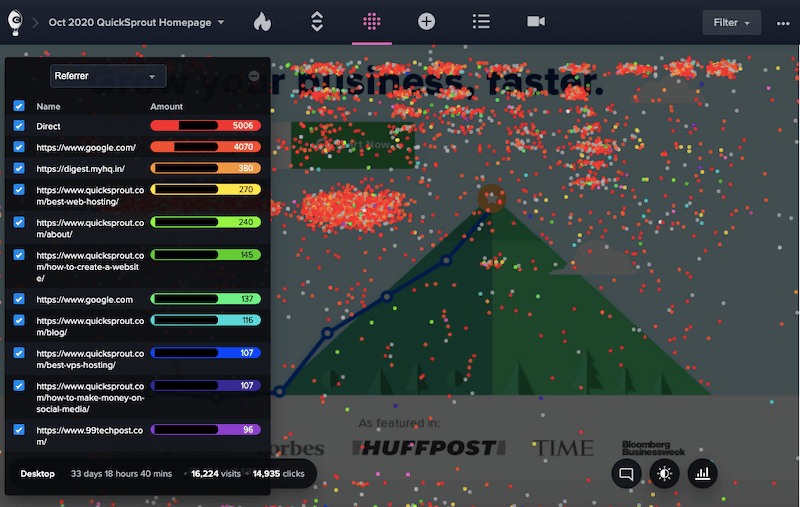
The Overlay Report is based on the clicked elements on your page. This specifically comes in handy in determining which call-to-action is performing the best.
And finally, the List Report will display all elements that have received clicks on your page. It’s more of a numerical report than a visual representation of your visitors’ clicking pattern.
All in all, you get a comprehensive heat mapping experience with Crazy Egg.
Then there’s a standard recording feature that shows you how visitors interact with your website and how they behave during different stages of the buying process. You can segment visitors based on attributes like New, Mobile, or Most Active visitor.
What’s more, you can leverage its built-in A/B testing tool to analyze and compare different variants for a similar element. You can run A/B tests for elements like content placement, color, website copy, image, etc.
Another area where Crazy Egg hits the sweet spot is its no-code editor. Once you run A/B tests or analyze your website using heat maps, you can modify website content right away from your admin area.
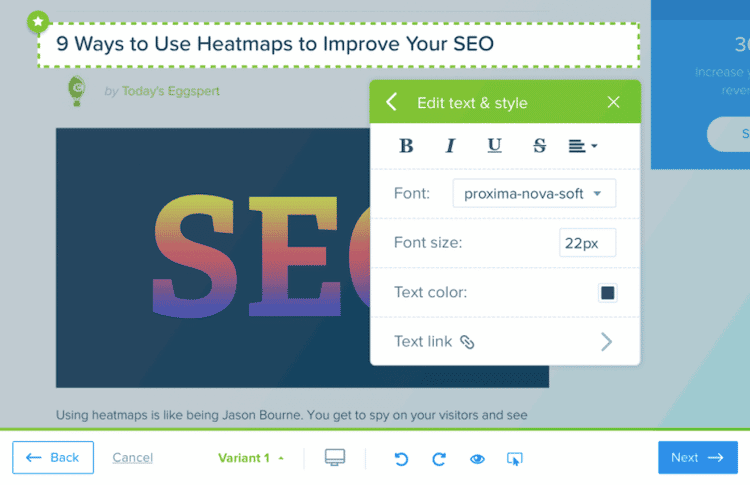
The visual editor lets you modify (or even eliminate) elements like colors, fonts, text, and more.
You can also get a complete demo dashboard here.
Pricing Plans:
CrazyEgg has five pricing plans:
- Basic ($24 per month) – 30,000 monthly page views, 25 heatmap snapshots, 100 recordings/mo, 3 months recording storage, unlimited A/B tests, unlimited websites.
- Standard ($49 per month) – Everything in the Basic plan + 75,000 monthly page views, 50 heatmap snapshots, 500 recordings/mo, 1 year recording storage.
- Plus ($99 per month) – Everything in the Standard plan + 150,000 monthly page views, 75 heatmap snapshots, 1,000 recordings/mo, 2 years recording storage, priority support.
- Pro ($249 per month) – Everything in the Plus plan + 500,000 monthly page views, 105 heatmap snapshots, 5,000 recordings/mo, 2 years recording storage.
- Enterprise (Quote-based) – Everything in the Pro plan + unlimited page views, unlimited recordings, etc.
Note that all plans are billed annually. You also get a 30-day free trial with all of these paid plans.
4. FullStory
Best for detecting visitors’ frustration points and visual reporting.
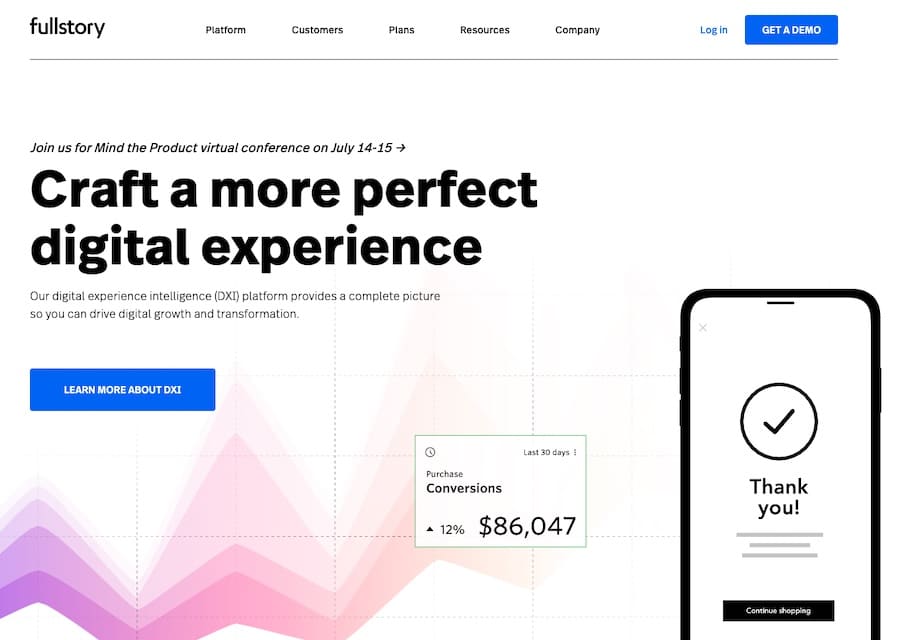
FullStory markets itself as a digital experience intelligence (DXI) platform that gives a complete insight into your site to help you drive digital growth and transformation.
They help you do it with standard heat map tools: click maps, move maps, and scroll maps.
However, FullStory’s most significant selling point is how they present the data. For one, they give you an insight into more than just the regular impressions and popularity of a specific element.
You’ll get access to metrics like segment health, error clicks, and rage clicks right from the first stage of heat map analysis.
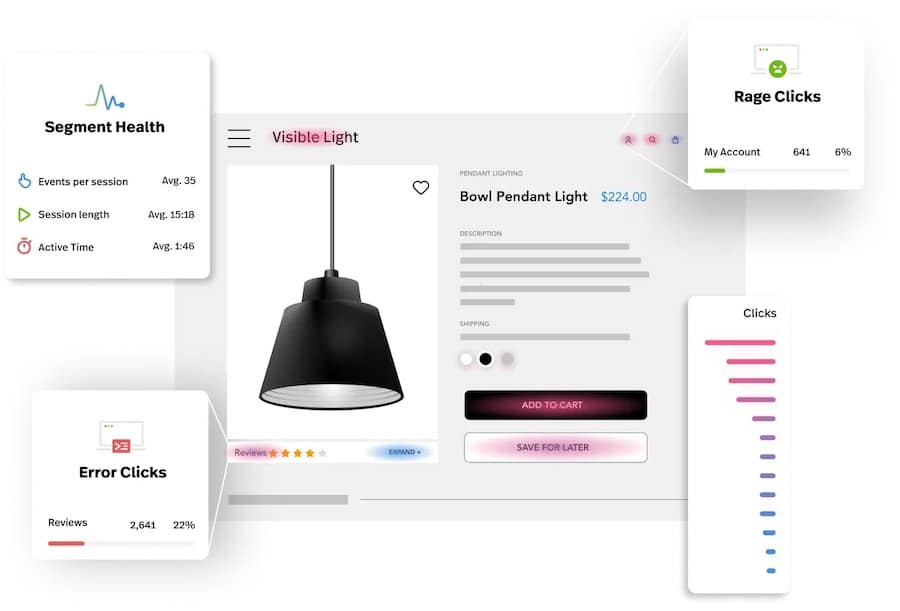
FullStory lets you see all these things in great detail and then further analyze them together in ways that make sense of visitor behavior.
I love how they break down all the metrics visually and in simple numbers, making everything easier to discern, even for a complete beginner.
Have a look for yourself; here’s a quick glimpse of FullStory’s analytics dashboard:
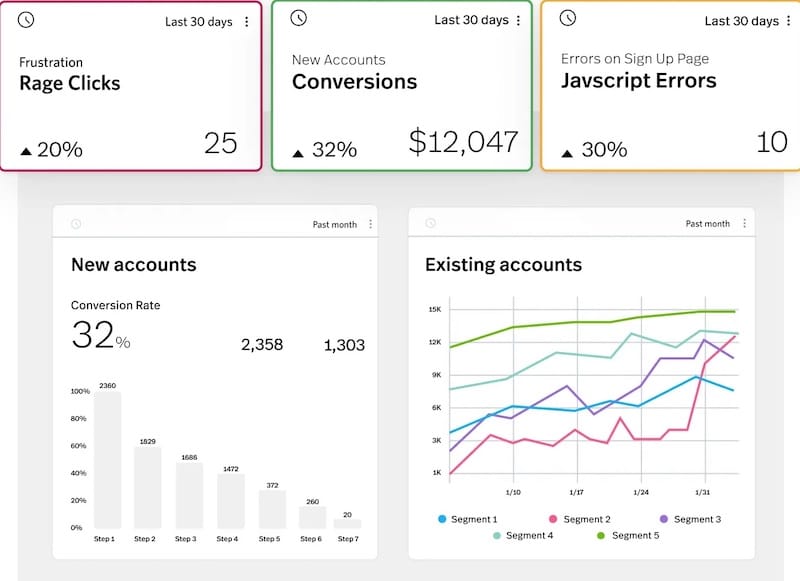
Here’s an overview of FullStory’s complete dashboard:
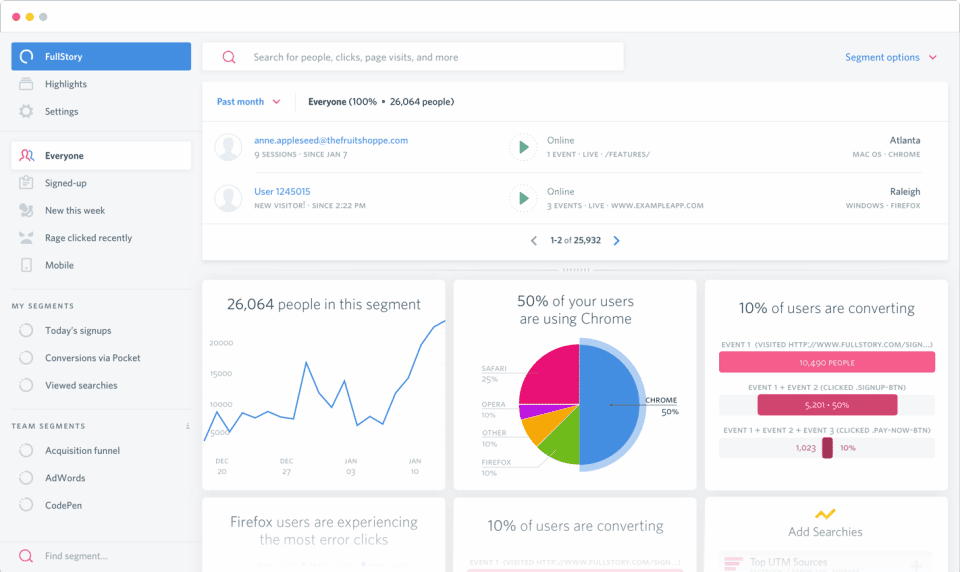
All things considered, their analytical reports are one of the best in the industry. They’re visual, easy to understand, and you can access metrics in different formats, such as bars, graphs, etc.
Other key features include session recordings, bug tracking, conversion funnels, and advanced visitor filtering and segmentation. You can segment visitors based on attributes like behavioral patterns, time, referral source, or even add your custom tag.
Pricing Plans:
FullStory offers quote-based pricing plans that also provide a 14-day free trial. However, online reviews on sites like G2Crowd and Capterra suggest that it comes with a hefty price tag.
You do get a freemium plan that provides access to up to 1000 sessions per month.
5. Lucky Orange
Best for startups and small businesses looking for an affordable Hotjar alternative.
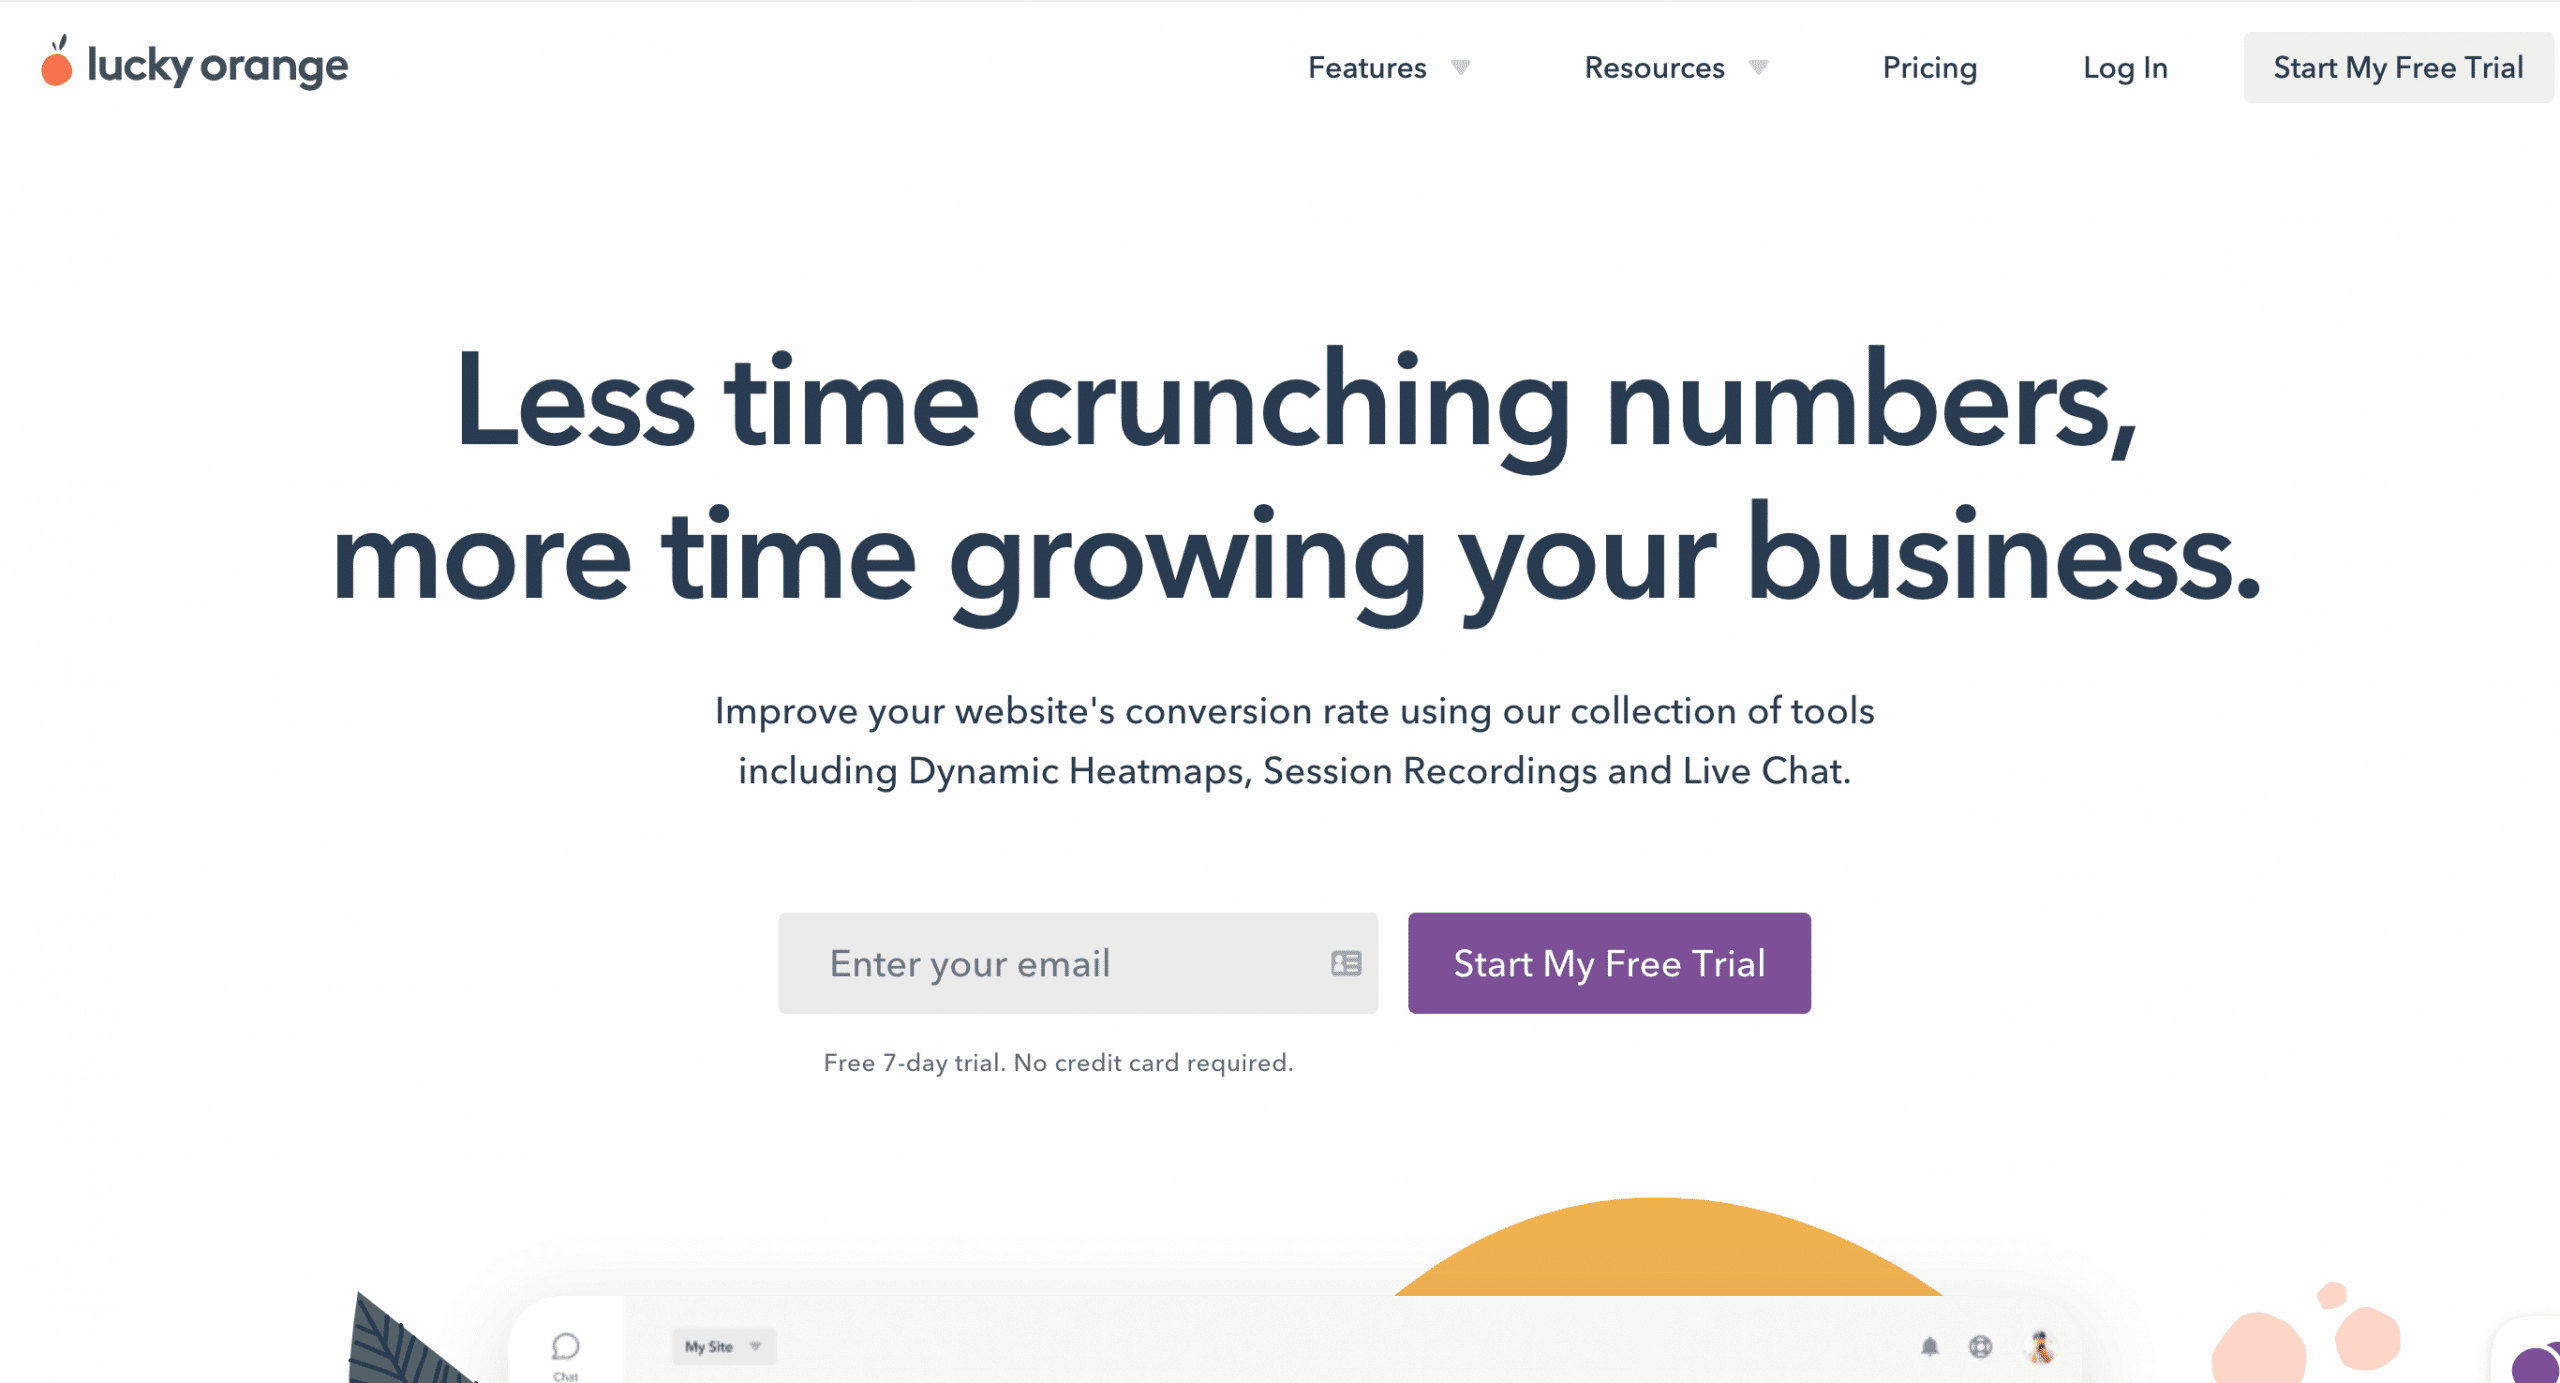
Lucky Orange is one of the most affordable website optimization and heat map software on this list. That said, they don’t cut any corners when it comes to their features either.
First, Lucky Orange makes recordings that you can play back later, like movies, to see how people truly use your website.
It then aggregates the data into heat maps to show you how people read your pages, interact with elements, and how far they scroll down the page. Your standard heat maps – scroll maps, move maps, and click maps.
You can further filter the audiences based on their browser, and referral source and even add behavioral tags to segment results on your own.
Next, they have an impressive Form Analytics feature that can provide helpful information, such as how many people are submitting the form on any given day, the average conversion rate for each form, etc.
You’ll be able to analyze every field in your form with Lucky Orange’s five major reports, including:
- Abandonment Report – Analyzes which field(s) in your form are causing abandonment.
- Time to Start Report – How long does the visitor stay on the page before filling the form?
- Field Time Report – Which field in your form is taking the longest to fill out?
- Order Report – Find out the order in which visitors are filling the fields.
- Repeated Field Report – Which fields were amended the most?
Lucky Orange also allows you to create unlimited conversion funnels based on behavior tags to see precisely where your visitors are dropping off, their pain points, and more.
What sets the software apart is its fully responsive Live Chat feature for both desktop and mobile. The built-in live chat feature comes with advanced features like canned responses, the ability to chat with multiple customers simultaneously, co-browsing while chatting, custom data API, and more.
And the list of features doesn’t end here.
Lucky Orange also lets you run visitor polls and surveys that can show messages, email results, etc. You can even show your polls at specific times and to specific visitors based on their location and browser.
Pricing Plans:
Lucky Orange offers five pricing plans:
- Starter ($10 per month) – 25,000 monthly pageviews, 1 site, 2 operators, unlimited heat maps, unlimited recordings.
- Small Business ($20 per month) – Everything in the Starter plan + 60,000 monthly pageviews, 3 sites, 4 operators.
- Medium ($50 per month) – Everything in the Small Business plan + 200,000 monthly pageviews, 8 sites, 10 operators.
- Large ($100 per month) – Everything in the Medium plan + 500,000 monthly pageviews, 16 sites, 20 operators.
- Enterprise (Quote-based) – Everything in the Large plan + up to billions of page views.
All the paid plans also come with a 7-day free trial and free phone, email, and chat support.
6. VWO
Best user insight software to analyze visitor behavior and running campaigns to retain visitors.
VWO (Visual Website Optimizer) is a conversion rate optimization platform that comes with a number of features intended to make your job easier as you continue working on improving your website’s overall performance.
The complete suite of built-in tools is grouped into different parts, such as:
- VWO Insights:
The VWO Insights suite includes tools like heat maps, session recordings, conversion funnels, on-page surveys, and form analytics.
Conversion funnels provide visual graphs that help you identify at which stage in their journey visitors are losing interest. Everything is straightforward, visual, and easy to understand, making it a perfect option even for beginners.
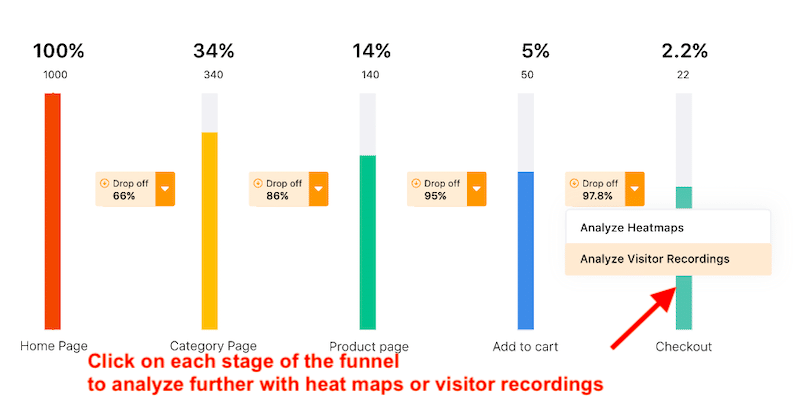
And you can further discern why they’re dropping off using heat maps and session recordings.
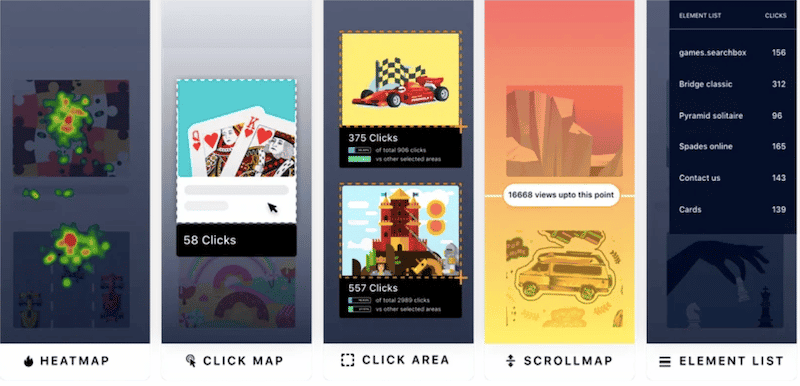
Aside from three regular snapshots (click maps, move maps, scroll maps), VWO has two more heat map types.
The first is the Click Area that lets you select multiple elements on your web page and compare their number of clicks. And the other is the “Element Lists,” where you get click data of all the elements in the numerical form.
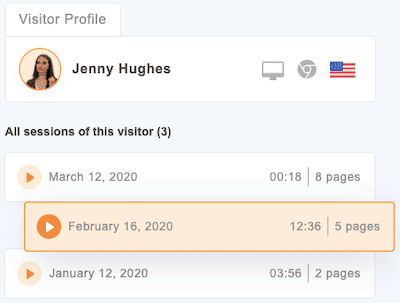
While the session recording isn’t any different than Hotjar or other platforms on the list, VWO’s recordings function in tandem with funnels to provide individual visitor profiles. These “Visitor Profiles” contain a complete overview of the visitor’s cumulative browsing journey across segments.
You can also leverage advanced visitor segments (new vs. returning visitors, traffic source, paid or organic, browser, parameter) and advanced filters.
Other key features include surveys (with different question types, including NPS) and form analytics (to discern why users are abandoning your forms).
Finally, turn all the acquired data into testing roadmaps – which brings us to the next feature.
- VWO Testing:
VWO Testing includes advanced analysis and testing features like A/B testing, multivariate testing, split URL testing, etc. The point-and-click visual editor that makes it easy to create and run tests is one of its main selling points.
You can further edit any element on your webpage, add advanced widgets, preview changes, apply changes to multiple pages simultaneously, and even get alternate copy suggestions.
Other feature suites include:
- VWO Fullstack – For server-side testing and mobile app testing.
- VWO Engage – Run automated marketing campaigns through web push notifications, Facebook messenger, and cart abandonment campaigns.
Pricing Plans:
VWO has three custom pricing plans (features will vary based on the cost). However, the Capterra review suggests that the pricing plans start from $199/month for up to 10,000 viewers. All of these plans also come with a 30-day free trial.
7. Inspectlet
All-in-one user insight and website optimization software.
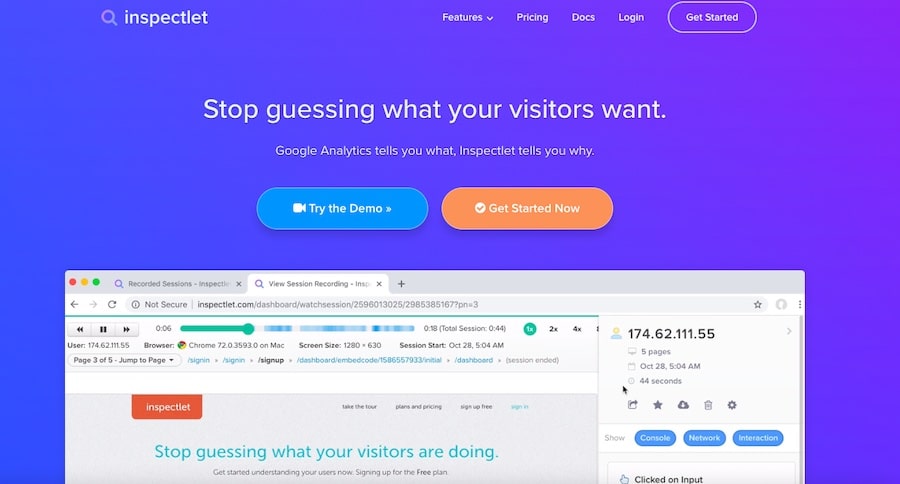
Inspectlet is an all-in-one user insight software and a stellar Hotjar alternative. It has all the tools you need to analyze how website visitors’ behave and how they respond to elements on your site.
With Inspectlet, you’ll get all the following set of features:
- Session recordings
- Form analytics
- Error logging
- Dynamic heat maps (move map, click map, scroll map)
- A/B testing – Create different versions and compare metrics like URL views, click rate, engagement, etc.
- A visual editor to quickly modify attributes after running an A/B test.
- On-page feedback surveys (with multiple question types like NPS, open-ended surveys, etc.)
It’s an extensive list of user insight features, but nothing out of the ordinary.
However, they do offer powerful filtering capabilities. For example, you can even filter results by a precise navigation path taken by the audience. Or you can view people who reached their carts but never checked.
Plus, you can tag your sessions and visitors using AND/OR logic.
Pricing Plans:
Inspectlet offers 10 pricing plans:
- Free ($0/mo) – 2,500 recorded sessions/mo, 25,000 pageviews/mo, 1 website, dynamic heat maps, session recordings.
- Micro ($39/mo) – 10,000 recorded sessions/mo, 100,000 pageviews/mo, 1 website, dynamic heat maps, session recordings.
- Startup ($79/mo) – Everything in the Micro plan + 25,000 recorded sessions/mo, 250,000 pageviews/mo, 3 websites, conversion funnel analytics.
- Growth ($149/mo) – Everything in the Startup plan + 50,000 recorded sessions/mo, 500,000 pageviews/mo, 10 websites, Form analytics.
- Accelerate ($299/mo) – Everything in the Growth plan + 125,000 recorded sessions/mo, 1,250,000 pageviews/mo, 20 websites, phone support, custom services.
- Enterprise ($499/mo) – Everything in the Accelerate plan + 250,000 recorded sessions/mo, 2,500,000 pageviews/mo, 40 websites.
- Enterprise ($749/mo) – Everything in the previous plan + 500,000 recorded sessions/mo, 5,000,000 pageviews/mo, 80 websites.
- Enterprise ($1199/mo) – Everything in the previous plan + 1,000,000 recorded sessions/mo, 10,000,000 pageviews/mo, 100 websites.
- Enterprise ($1799/mo) – Everything in the previous plan + 2,000,000 recorded sessions/mo, 20,000,000 pageviews/mo, 100 websites.
- Enterprise (Quote-based) – Everything in the previous Enterprise plan + unlimited session recordings, unlimited pageviews, and unlimited websites.
8. SessionCam
Best for mapping customer journeys to find the most optimum route to conversion.
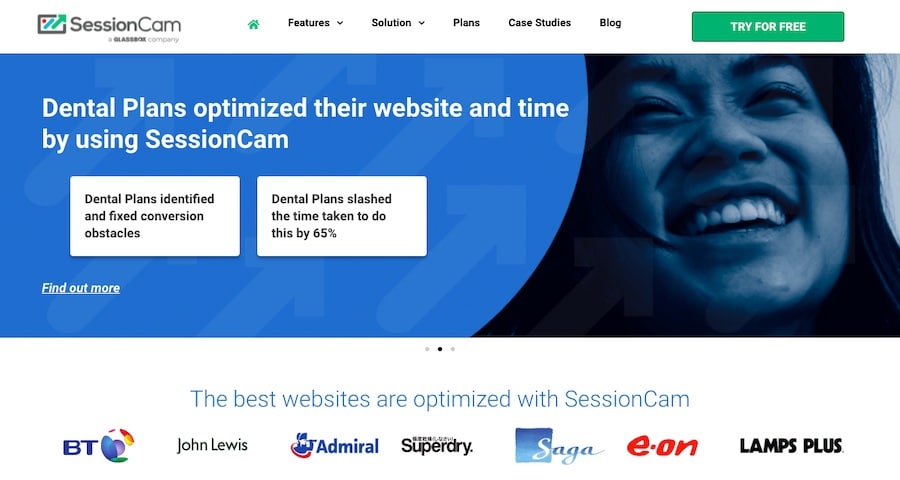
As a session recording software, SessionCam can be used for many different purposes.
The first and the most straightforward one is to record user sessions of your website and check how people are using it to gain valuable insights into how to improve the site or product.
Next, they provide four different types of heat maps: Click, Mouse Movement, Scroll Reach, and Attention (along with advanced segmentation options).
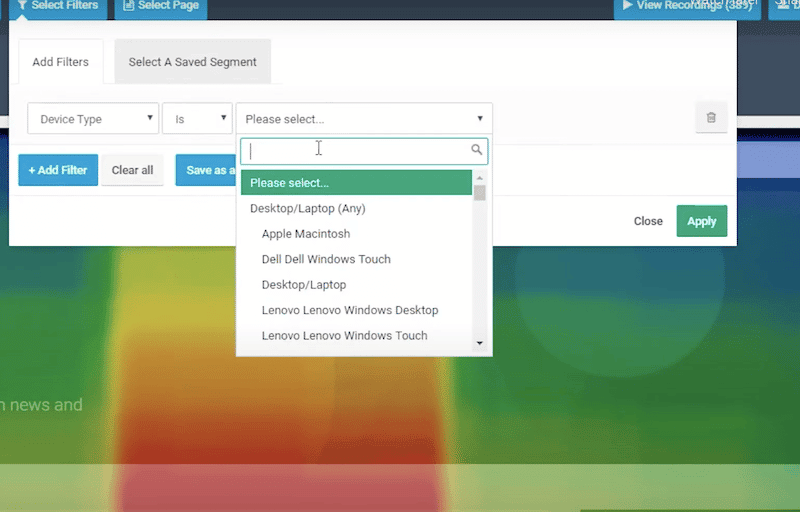
You can also compare heat maps side by side to analyze visitors’ behavior across segments. Plus, all the heat maps are dynamic and can analyze responsive and dynamic websites as well as static web pages.
Other prominent user insight features include conversion funnels, form analytics, error detection, struggle detection, and more.
They also have a customer journey mapping feature that helps you identify the most optimum route to convert visitors. This goes beyond regular conversion funnels and actually maps your path towards conversion. That’s a huge bonus!
What’s more, you can use the journey mapping feature along with other SessionCam features like form analysis, conversion funnels, etc., to get the best results.
However, SessionCam doesn’t have any feature to create on-page surveys. You can integrate with other survey platforms, though.
Pricing Plans:
SessionCam comes with two quote-based plans and a 14-day free trial. Contact their team for a demo and pricing.
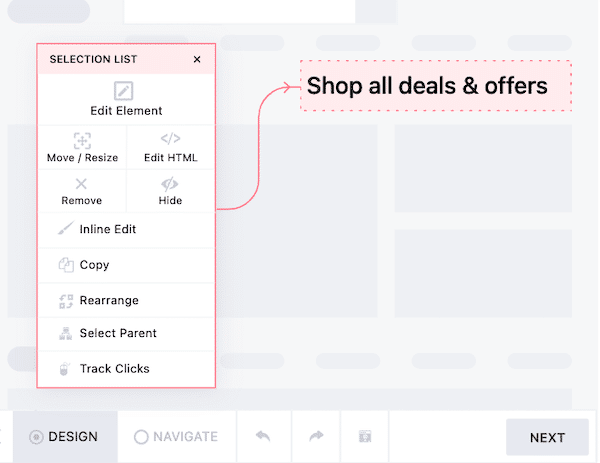
9. Contentsquare (Formerly Clicktale)
Best for analyzing and comparing entire elements on a webpage.
Contentsquare provides journey analysis and zone-based heat maps to help you analyze how visitors interact with entire elements – hence the name, Contentsquare.
The zone-based heat maps provide you with:
- An aggravated view of scrolls, clicks, and overall movement.
- Revenue or conversions are provided by each element on the webpage.
- Side by side comparison (testing of crucial campaigns and variations).
In addition, they provide an “AI-based analytics” feature that automatically uncovers issues, anomalies, and opportunities available on your web page.
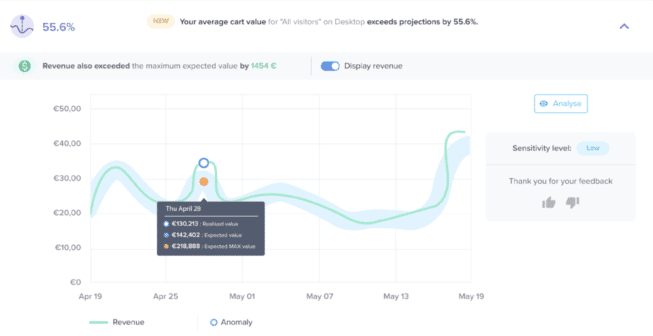
You’ll get instant alerts, opportunity scoring, rage click detection, and even a digital happiness index.
Other key features include:
- Mobile app analysis
- Merchandising analysis (insights into the category, product, and brand performance)
- Struggle analysis (to find errors that are hampering visitor journey)
- Session replay
- Event-triggered recordings
Pricing Plans:
Pricing plans aren’t available on the site. You can contact their team for quote-based plans.
That’s a Wrap!
The market is now full of handy funnel analysis tools and website analytics tools that you can use to create statistics from your website and watch how users behave there. After reading this article, you have now come across a number of alternatives to Hotjar.
The final decision is up to you and what requirements you have.
For example, if you’re looking for an all-in-one solution, you might prefer FigPii, VWO, and Inspectlet. When you use heat maps and recordings in tandem with surveys and form analytics, you will be well on your way to optimizing your site. Built-in A/B testing capabilities are the icing on the cake.
And if you’re on a tighter budget, you might like Lucky Orange, Crazy Egg, and FigPii.
There are also options available that help you analyze entire conversion funnels. For example, SessionCam not only lets you visualize your customer journey with funnels but also suggests the most optimum paths to conversion.
The good news is that most of them come with a freemium plan or a free trial, allowing you to test their features yourself before upgrading to the paid plan.