Conversion Intelligence Platform
52,000+
A/B experiments
70,000+
Crawled websites
Log in and see every conversion opportunity, every test’s revenue, and all the work in motion.
We can promise that because we’re more than an agency. CRO Catalyst, our conversion intelligence platform, mines 70,000+ sites for what actually wins, then our expert pod ships those tests on your site.


Most CRO companies sell you one or the other. You get both, working as one.
Log in and see every conversion opportunity, every test’s revenue, and all the work in motion.
Senior specialists who turn the platform’s findings into shipped, revenue-positive tests.
Since partnering with Invesp, we’ve seen a lift in our conversion rates of around 18–20%, and incremental revenue over the total time we’ve been working with Invesp has been about $900,000.

CRO Catalyst is the conversion intelligence platform at the center of everything we do. It’s also yours to log into. Here’s what you see.
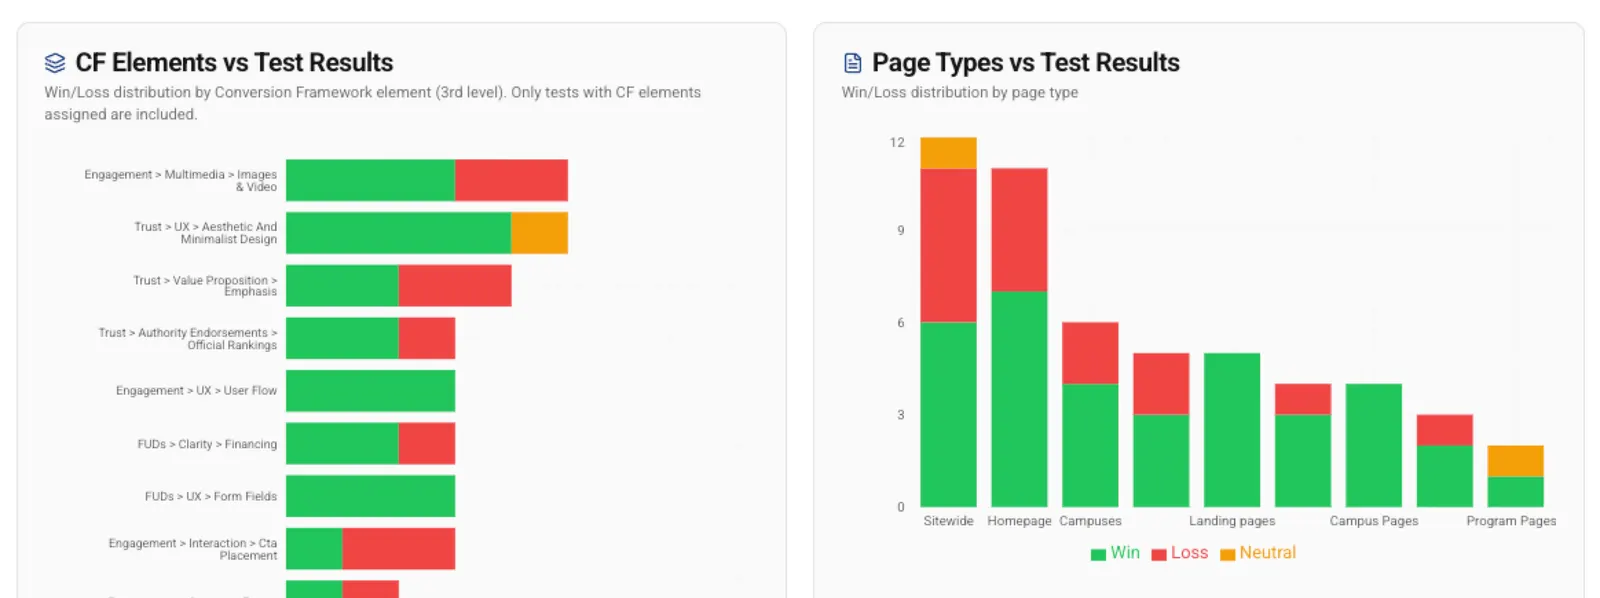
The platform identifies where visitors hesitate and drop off, organized by conversion pillar, so you understand not just where you’re losing people but why they don’t convert.
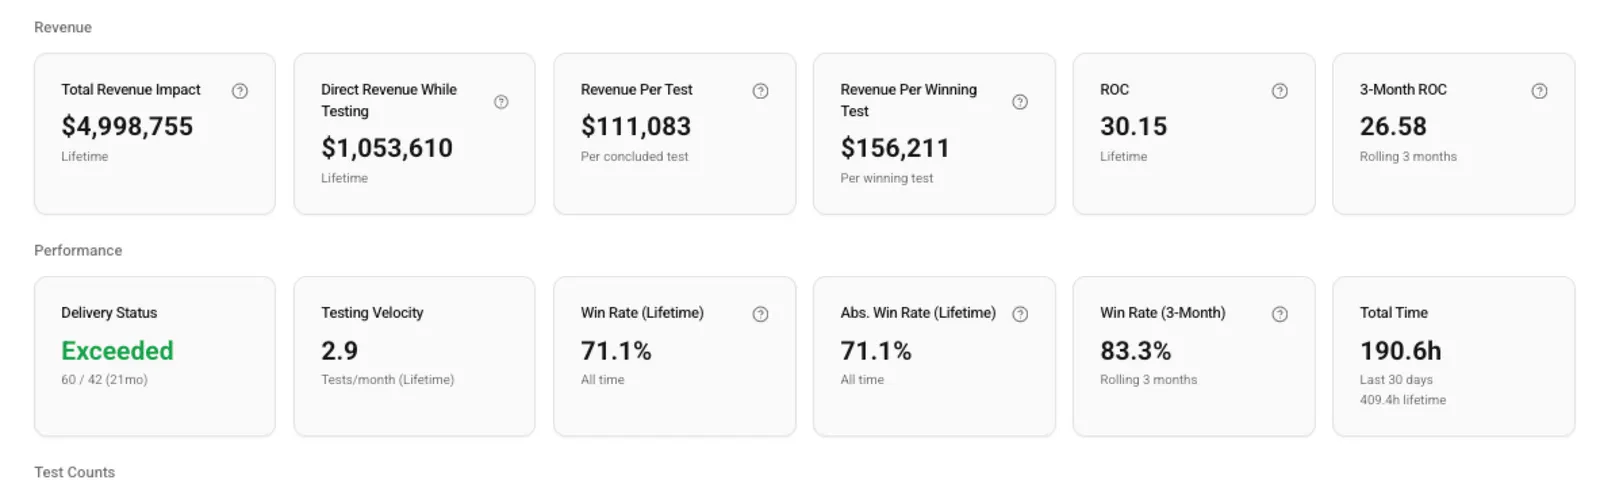
Advanced analytics on your site, tied directly to the conversion opportunities that matter. The numbers point at action, not just dashboards to admire.
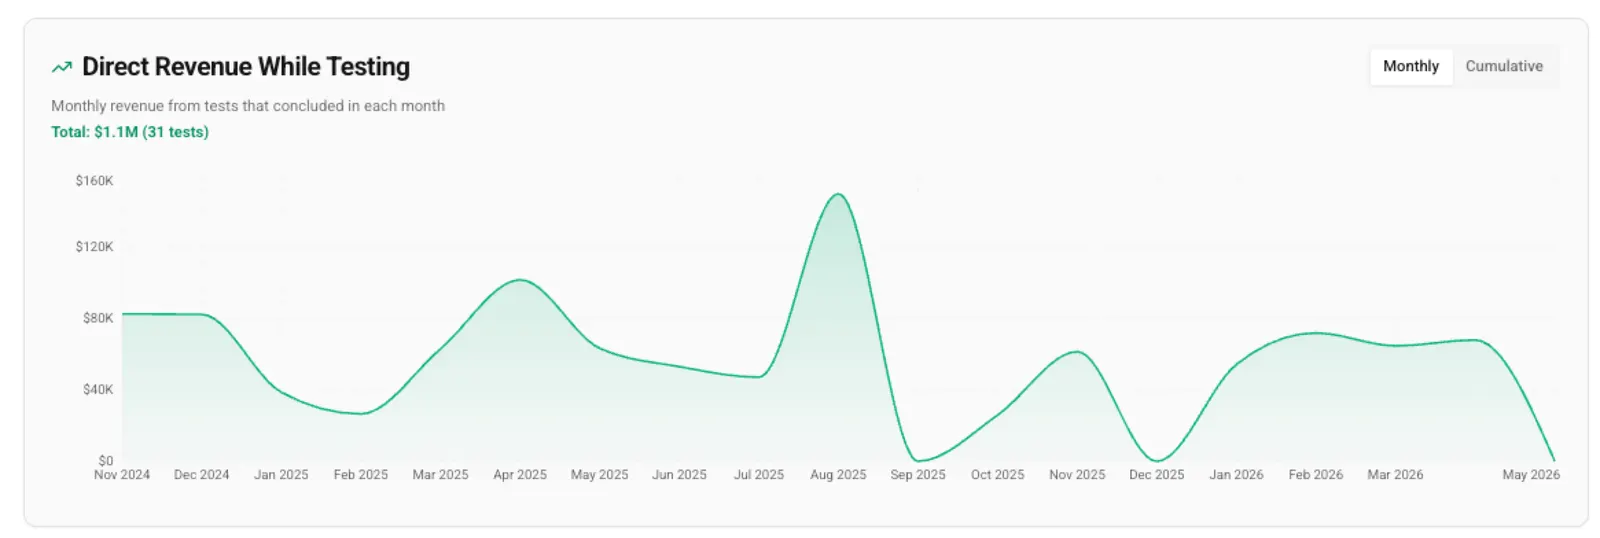
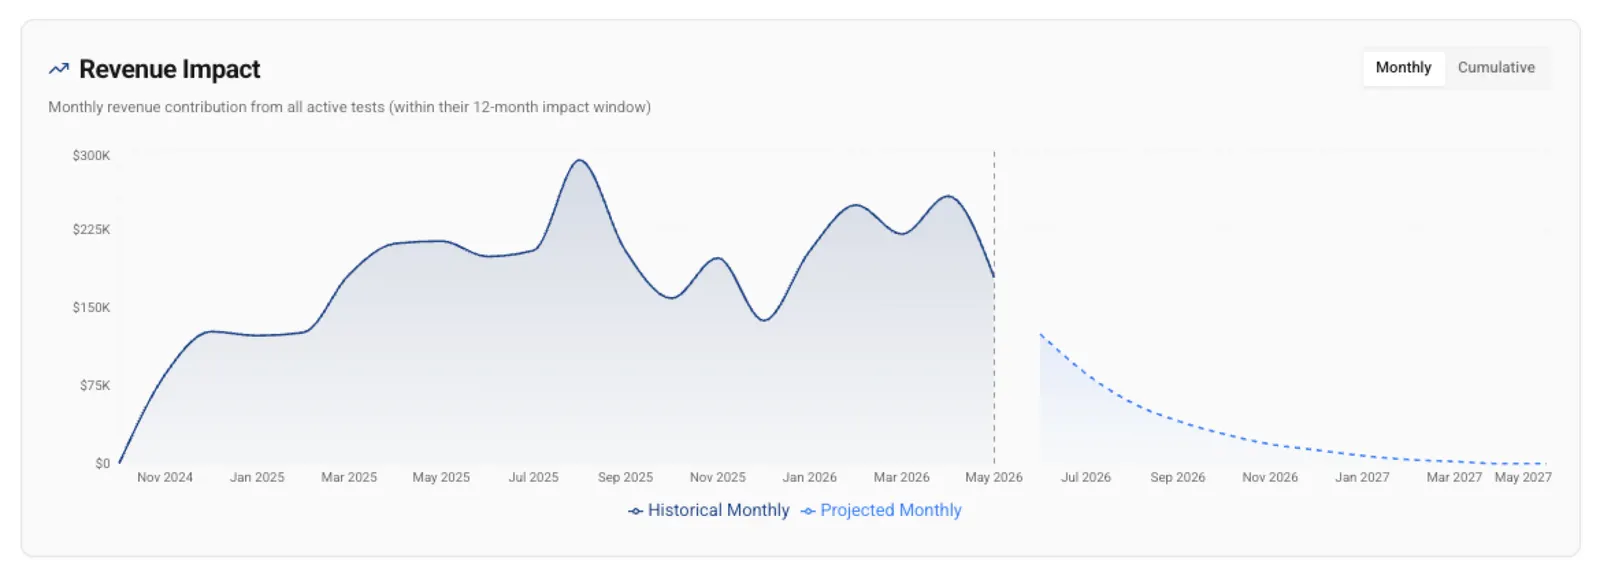
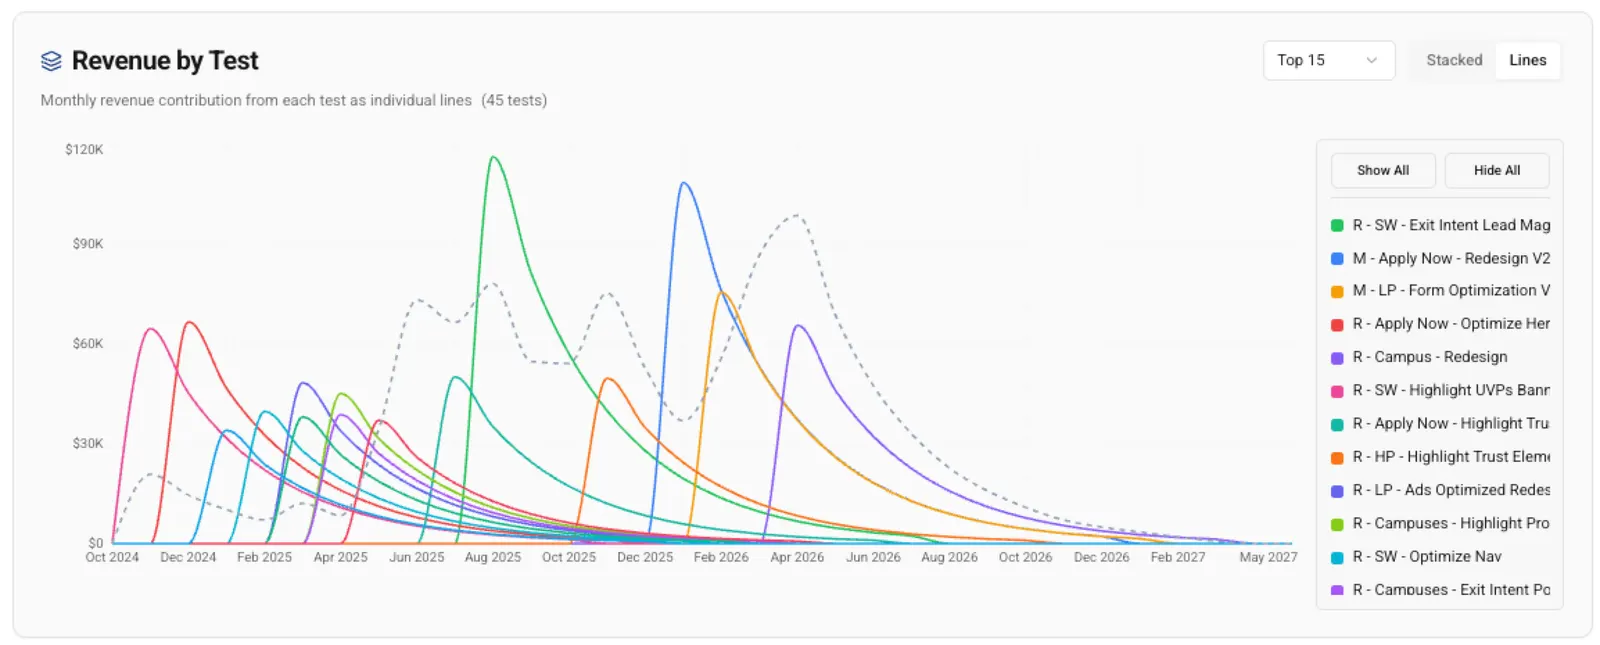
See the revenue performance of every A/B test we run, in dollars. You always know whether the work is paying off, because the proof is in front of you, not in a quarterly slide.
Everything the pod is doing, visible in one place. No status-update emails, no wondering what you’re paying for. You see the program in motion.
See how your conversion approach stacks up against competitors in your space, so your roadmap is informed by the market, not just your own site.
No scripts, no actors — just operators talking about the lift they measured working with our pod.
“Their speed allowed us as a business to increase the velocity of our testing.”

“We’ve been really pleased with the results. 33% lift on our product pages alone.”

“I highly recommend Invesp if you’re looking for a long-term conversion optimization strategy.”

Most agencies guess, test, and hope, and bill you either way. We don’t get paid until your conversions go up, because we don’t start from guesswork. We start from what 70,000+ sites have already proven.
CRO Catalyst crawls more than 70,000 sites for patterns that are already winning, on top of the 52,000+ tests we’ve run ourselves since 2006. We don’t start from a blank page wondering what might work. We start from what’s proven and tailor it to your site. Higher win rate than testing cold, and the reason we can tie our fee to your lift.
We’ve done CRO and only CRO since 2006. No SEO side hustle. No web design distractions. One thing, done longer than almost anyone.
A tool with no team is shelfware. A team with no data engine is guessing. We’re the only ones giving you both as a single product, which is why the work moves faster and the results hold.
Between the platform’s live view and our blunt readouts, you always know what worked, what didn’t, and what’s next. No fluff, no spin, nowhere to hide.
A few of the wins our pod has shipped. Every number is measured lift on a live site, not a projection.
We experienced a continual increase in the conversion rate of our website, which likely resulted in over $1M or more in increased sales.

Not a menu to pick from. It’s a complete system. Every engagement includes all of this, weighted to what your site actually needs.
Research, hypotheses, design, dev, QA, analysis, iteration, then the next round. This is the engine; everything below feeds it.
Heuristic review, analytics review, heatmaps, session replays, customer voice mining. We find what’s leaking revenue and rank what to fix first.
Most sites are flying blind because their tracking is broken. We fix that first (events, funnels, segments, attribution) so nothing else is built on bad data.
Polls, user tests, heatmaps, session replays, customer interviews. We figure out why people don’t buy, not just where they drop off.
Our designers and developers build variations directly in your testing tool: VWO, AB Tasty, Optimizely, Convert, Adobe Target, or FigPii.
We bring your in-house team along as we go, so the thinking compounds inside your org, not just on our side of the table.
We secured a 4x ROI within the engagement’s first week. I never saw returns like that before.

Same platform. Same senior pod. The only difference is how you pay and where you are right now.
Up to 30% more conversions in 90 days. You only pay for the lift you get.
Performance pricing isn’t for every finance team. Get the full platform and pod at a flat monthly fee instead.
A smaller version of the same system, sized to where you are.
Most agencies make you wait out months of research before a single test ships. We don’t. From day one we run two tracks in parallel: a testing track that’s live in week two and never stops, and a research track that makes every test sharper as it compounds.
Your first test goes live on day 15, the second around day 30. These are high-confidence plays we’ve seen win across 52,000+ tests. From there it’s a regular, continuous cadence. You get movement in weeks, and it keeps coming.
Running the full 90 days alongside the tests: analytics, expert review, heatmaps, session recordings, user research, customer interviews, and competitive analysis. By the end of the quarter it hands you a prioritized roadmap: the plan that drives your testing from there on.
Revenue movement inside the first month, continuous testing throughout, and a research-backed roadmap by day 90. Both tracks are running from day one.
Real tests our pod shipped on live sites. Slide each one to compare the original against the winning variation, then browse the rest below.
Rewrote the headline, dropped the subtitle, and added a UVP slider.
The platform finds the opportunities. This is the team that builds, ships, and proves them. One pod, working roles, no agency layer and no account manager translating between you and the people doing the work.
Owns the program. Builds the testing roadmap, prioritizes the backlog, and runs your monthly readouts.
Turns research into hypotheses and hypotheses into shipped tests. 10+ years of experience on average.
Designs variations that convert. UX and UI specialist who designs for testing, not for design awards.
Builds test variations cleanly in your testing tool. No site breakage, no flicker, no surprises in production.
Catches the bugs before your customers do. Cross-browser, cross-device, cross-funnel. Every test gets a full QA pass.
Lives in GA4, BigQuery, and the platform. Builds the data case for every hypothesis and every readout.
Runs the polls, user tests, replay reviews, and interviews that tell us why people don’t buy.
Real, verified reviews from current and recent clients. Most lead with a hard result.
Clutch4.9/5We’ve seen a 42% increase in conversion rate on desktop and a 35% increase on mobile.
Invesp has helped us generate over $2.5 million in revenue ... Our ROI is 11 times better than before we started.
They improved our conversion rate by about 16%.
With Invesp’s support, we’ve been able to secure a revenue of over $1 million.
Overall, the team is proactive, energetic, creative, and effective.
Their thoughtful approach to testing is excellent.
We were impressed with the way they were able to execute things very quickly.
We experienced a continual increase in the conversion rate of our website, which likely resulted in over $1M or more in increased sales.
By implementing their technology, we boosted those projections by 17% ... we secured a 4x ROI within the engagement’s first week.
Since implementing Invesp’s recommendations, visitors to our landing pages spent roughly 300% more time on the pages.
We saw a significant increase in conversion rate ... We’ve also seen an increase in leads and subsequent sales.
They’ve been the secret to our success; it’s a night and day difference.
Invesp helped us dramatically decrease our cost per lead.
I appreciated that things were under-promised and over-delivered.
We’ve seen a lift in our conversion rates of around 18%–20%, and incremental revenue ... has been about $900,000.
A couple of the other tests have seen over 20% improvement, especially on the mobile side.
One was actually a seven-figure win, which increased revenue by over $1 million in one year.
Their process is remarkable — I wish all agencies worked how Invesp does.
The breadth of knowledge Invesp has on A/B testing is impressive.
They were willing to help us all the time; I would work with them again.
What I really liked was their punctuality and professionalism in terms of communication.
Our conversion rate from registrants to active users was 13% ... we’ve maintained a rate of 50%–75%.
Our conversion rate was only 4% when we started working with Invesp — we’re regularly around 5.5% now.
Invesp’s work has helped generate close to $1 million in revenue for us.
Our conversion rate increased, our bounce-rate decreased, and we’ve seen an increase in returning visitors.
Invesp provides a service while teaching us how to do conversion rate optimization properly.
Their attention to detail and ability to uncover things are impressive.
Book a 30-minute call. We’ll point CRO Catalyst at your site, show you where you’re leaking conversions, and tell you straight whether we’re a fit.