There are few key performance indicators that everyone focuses on for an e-commerce store: conversion rates, average order value, and the number of monthly visitors, site revenue, and the cost per acquisition. These metrics translate into money in the bank (or lack thereof).
Each of these KPIs is influenced by a variety of other metrics that causes them to go up or down.
It is important to state that abandonment rates are incredibly site-specific. Establishing market standards for them is difficult. Each site, with its customer base and specific audience, will require its unique evaluation and solutions.
What is an abandonment rate?

Thinking about shopping at a brick-and-mortar store helps to understand the dynamics of e-commerce abandonment better. Think of a customer arriving at a store and walking around the isles looking at the different products. When the customer walks into a store, the conversion process begins. Getting the consumer, along with their full cart, through the checkout line and off to his house is a successful conversion. However, a number of factors can interrupt the conversion process and cause abandonment.
Interruptions are one of the leading causes of abandonment, as e-commerce customers are not a captive audience as they are in the offline marketplace. A customer shopping at home can encounter both offline interruptions and online interruptions.
“Digging a little deeper to see why customers aren’t buying, and determining how to make the process as push-button simple as possible should be the end goal.”
All these interruptions add up to abandonments where customers walk out of the store without ever buying anything.
Before delving deeper into understanding the different abandonment rates, what they indicate, and what you should do about them, keep in mind that the best way to resolve any abandonments your site suffers from starts by creating the best shopping experience you can. That is easier said than done. No designer or marketer sets out to create a bad shopping experience. But the web is full of them.
Why is that?
it is typically for one of two reasons:
- We make too many assumptions about how people shop for our products: how do they search for products, how do they compare them, how do they go about selecting the right product for their needs, and how they finish the shopping experience.
- We do not independently test the shopping experience on the site. We assume that it works for different visitors coming with different intent; we assume that it works on different browsers, devices, and operating systems; we assume that it is error-free; we do not deal with all the FUDs that we could be causing visitors.
We discussed the real reasons visitors abandon e-commerce and shopping carts.
Fixing the shopping experience: mapping abandonment rates to visitor intent
I have been very vocal about my dislike of how many marketers (including CROs) handle analytics. For the most part, analytics is used to look at the performance of a single page on the website, its number of visitors, views, bounce, and exit rates. Some try to go a bit deeper by looking at conversion metrics for different browsers, operating systems, and device types.
 These are good ways to uncover surface-level conversion problems for a website. These tactics can be useful to use at the start of a conversion project. However, if you are looking for more in-depth insights from analytics, I suggest looking at analytics in different ways:
- Start by grouping visitors based on their interaction with your website (their intent to convert)
- Analyze the group behavior around your site: what pages do they visit, what products do they view, where do they get stuck, where do they exit from and so on.
Mapping The Reasons People Abandon Shopping Carts
People don’t just abandon their shopping carts; something causes it. When analyzing visitor intent on an e-commerce website, I think of the following six segments:
- Visitors who landed on the site by mistake
- Visitors with little interest in the website
- Visitors with a moderate interest
- Visitors with a high interest
- Visitors who are ready to convert (but did not convert yet)
- Converters – those who placed an order
It is vital that each of these groups is exclusive – so a visitor does not belong to two groups at the same time. As a visitor navigates around the website, he graduates from one group to the next.
These six visitor segments relate directly to the reasons why different abandonment rates on an e-commerce website. I will exclude two groups from the article:
- Visitors who come to your site by mistake: these are the visitors who bounce off your site right away. Since this segment includes single-page visits, you can analyze the top pages with high bounce rates, look at the traffic sources, pre-site messaging, and determine why these visitors are exiting your website right away.
- Converters: converts provide a wealth of information about what is working on your site. But since this article deals with abandonment, these visitors did not abandon your site, they went through your funnel and placed an order.
Abandonment means lower revenue and higher cost per acquisition
Your goal is to get as many people to convert. More conversions mean more revenue and a lower cost per acquisition.
Any type of abandonment means that you lost the battle. If you cannot persuade visitors to navigate to your product pages, they will not place an order.
If people make it to your product pages but don’t click on the add to cart button, then you again missed an opportunity to generate revenue from that visitor.
Pre-product page abandonment rate
This rate is the percentage of website visitors that land on different pages of the website (excluding product pages) but never make it to the product pages.
Pre-product page abandonment rate =
(sessions without product page views / total sessions for the website) *100
A site gets 200,000 visitors per month. Of these, only 50,000 visitors navigate to the product pages. The remaining 150,000 visitors never visit the product pages.
The Pre-product page abandonment rate = 150,000/200,000 * 100= 75%.
I opted to use sessions in this calculation, and I could have used visitors. Which metric you will use to calculate your pre-product abandonment rate depends on how you set these in your analytics.
Which visitor segment does the pre-product page abandonment rate relate to?
Visitors with little interest are those visitors that land on an e-commerce website but never visit a product page. This segment represents the visitors who are responsible for the pre-product page abandonment.
There are instances where we like to define visitors with little interest are those who visit more than one non-product page but never get to a product page.
Why does the pre-product page abandonment rate matter?

Getting visitors to your product pages is one of the first battles you must win to get a conversion. For most e-commerce stores, visitors only add products to their cart page from the product pages (as opposed to adding products from the category pages). So, a visit without a product page view does not generate a conversion.
This segment represents visitors who have little interest in the website.
They did not outright decide to leave, but the site was not persuasive enough to convince them to go more in-depth into it.
Side note: for years, I told e-commerce companies to remove the “add to cart” button from the category pages. I wondered if anyone, ever, added an item from a category page. I should have been more careful. We were implementing tracking for a major online retailer and discovered that majority of visitors (70%+) added items from the category pages. This is not a typical behavior that I have seen on other websites, but it is enough for me to say: Yes, every site is different!
What does the pre-product page abandonment rate measure?
Several factors cause high pre-product page abandonment:
1. High bounce rate on your landing pages

Bounce rates track the percentage of visitors that land on a web page and then leave without navigating to any other pages. In the real-world metaphor, these are customers that enter the lobby of a store but walk back out the door without shopping.
If the majority of traffic lands on non-product pages and leaves the site right away, then you will end up with a high pre-product page abandonment rate.
Bounce rate measures how fast visitors decide if the website they landed on matches their expectations. As a result, bounce rates indicate how well a landing page is doing its job. There are several causes for a high bounce rate including lack of clear value proposition, lack of trust signals, and a disconnect between the pre-click messaging and the landing page messaging. According to Tommy Walker;
“You should be constantly building trust through the entire site experience, then reinforce your trustworthiness at the points where a visitor has to make a decision in order to progress.”
2. Potential problems in site navigation
How do visitors find products on your website? Do they rely on the navigation to locate the appropriate category before navigating to the product page? Site navigation can present a set of complex problems on an e-commerce site. If you do not create an intuitive navigation system that matches visitors’ expectations, you will end up with a high pre-product page abandonment.
3. Potential problems in category pages
If visitors navigate to category pages, but you still have a high pre-product page abandonment, then there is a good chance that the problem exists at the category page level. First, start by calculating the product to category view ratio to determine if you have a problem with the category pages. This is a very simple yet insightful metric.
Product to category view ratio = product pages page views/ category pages page views
This metrics provides an average of how many products a visitor navigates to while viewing a single category page. This ratio will vary based on the type of website you have and the products you sell. To put this in perspective, I have seen clothing websites with a ” product to category” view ratio anywhere from 9 to 16. On the complete opposite end, I have seen auto spare parts websites with a “product to the category” view ratio of 2 to 3. A low “product to category” view ratio means that visitors are getting stuck in your category pages; they are not making it to the product pages. There could be several reasons for this including:

- poor product classification in different categories
- poor product images on category pages
- poor filtering functionality
- poor sorting functionality
4. Potential problems in search functionality
The final cause of high pre-product page abandonment could be the site search functionality. There are two aspects you want to keep in mind when looking at the search functionality of the website.
- Users who use the search function on a site are a smaller set of overall website visitors. For most websites, only 20% of the visitors [or less] will use the search functionality. So, there is a good chance that search is not the primary cause for high pre-product page abandonment.
- Users who search function are 3 to 4 times more likely to convert compared to users who do not use the site search.
The first task is to create two segments in Google analytics:
- Sessions that include the use of search functionality but no visits to product pages
- Sessions that include the use of search functionality and a visit to product pages
Compare the different metrics for these two segments.

Example: Your site gets 200,000 sessions per month. Of those, 30,000 sessions use the search function on the site. When you run your advanced segment, you discover that 24,000 sessions use the search but never navigate to the product pages. That must be alarming. However, if you find out that only 3,000 use the search but never navigate to the product pages, then you can feel more comfortable with your site search functionality.
Shopping Cart abandonment rate
You would think that there is a precise definition of the shopping cart abandonment rate. However, if you do some research, you will see that few definitions are floating around.
The way we traditionally calculate cart abandonment rate is as follows:
Cart abandonment rate = 1- (orders placed with the website/number of carts on the website)
There are several issues with this definition.
A visitor clicking on the “add to cart” button will create a cart on your website. A few years back, e-commerce sites directed visitors who clicked on the add to cart button to the cart page automatically. That meant that these visitors would view the cart page regardless of their real interest in buying from the website or not. They will also make the conscious decision if they want to start the checkout process or abandon the cart.
Nowadays, that is a bit different.
Many sites (I did not do a formal survey) will NOT direct visitors to the cart page. Instead, sites might show a popup indicating that the visitor added an item to the cart. The visitor might abandon the website without ever viewing the cart page.
I suggest that a better definition of cart abandonment is:
Cart abandonment rate = 1- (Total number of orders/ the total number of visitors who added items to the cart and viewed the cart) * 100
You can create a custom segment in Google Analytics (or your analytics platform) to tracking the visitors who both added an item to the cart and then viewed the cart page.
If you do not wish to create a custom segment, you can alternatively use the following formula to calculate cart abandonment rate:
Cart abandonment rate = 1- (Total number of orders/ the total number of unique visitors who viewed the cart) * 100
Notice that we did not track clicks on the “add to cart” button in this formula. Multiple clicks on the “add to cart” button will create a single cart in most e-commerce websites.
Why does the cart abandonment rate matter?
Two visitor segments relate to cart abandonment rates:
- Visitors with a moderate interest in your products
- Visitors with a high interest in your products
Visitors with a moderate interest are the visitors who add items to their cart but never view the cart page. Visitors with a high interest in the site, on the other hand, are visitors who add products to the cart page, navigate to the cart but never start the checkout process. According to Kenneth Sytian;
“In order to deal with those that still abandon their carts, make use of retargeting and email. Give them a reason to continue with their shopping and that this time, they should complete it.”

Both visitor segments are good candidates to convert albeit at different levels of commitment.
You should choose one of the two definitions for cart abandonment and use it consistently.
What does the cart abandonment rate measure?
Let’s take a look at each visitor segment and consider what factors could be the cause for their cart abandonment.
Why do visitors with moderate interest abandon the site?
Remember that these visitors added an item to the cart but never actually viewed the cart page. Abandonment could be due:
- These visitors are comparison shopping and are not ready to commit
- The site does a poor job of reminding these visitors to view the cart and start the checkout process
Why do visitors with moderate interest abandon the website?
These are the visitors who added an item to the cart, viewed the cart but then never started the checkout process. So, this group has a higher level of interest. Abandonment for this group could be due:

- Poor cart page design
- High shipping cost
- Long delivery times
- Searching for coupon codes
- These visitors are comparison shopping and are not ready to commit
- The site does a poor job of reminding these visitors to view the cart and start the checkout process
“It’s essential to conduct high-quality usability and conversion research — use survey polls, watch live user recordings throughout the checkout process and see where users are getting stuck and dropping off. It isn’t a one-size fits all in check-out optimization — every e-commerce business has different audiences with different pain points causing them to drop off throughout the checkout funnel.”
The particular cause of abandonment for your site might vary. You will have to analyze your cart page, conduct qualitative research, create a hypothesis of why this might be happening.
Bonus: it might be worthwhile to evaluate what items do the abandoned cart contain:
- Do abandoned shopping carts have similar items in them?
- What is the average value of abandoned carts?
What is the average cart page abandonment rate?
Based on an analysis of over 300 e-commerce sites with annual revenue ranging from 10 to 75 million dollars per year, the average cart abandonment rate for desktops is between 65% to 75%.
From the same sample, there were five websites with cart abandonment rates above 90%. The same sample contained 31 sites with cart abandonment rates of around 85%.
Mobile cart abandonment rates have a very high variance, but for most, they are 10% to 20% higher than the desktop version.
Using e-mails to recover abandoned shopping carts
We discussed a detailed strategy with multiple steps to reduce shopping cart abandonment. The most popular and quick method is using psychological principles to craft cart abandonment emails that bring people back to the site and persuade them to place an order.
Checkout Abandonment Rates
The way we traditionally calculate checkout abandonment rate is as follows:
Checkout abandonment rate = 1- (orders placed with the site/number of visitors who started the checkout process)
The checkout abandonment rate represents the segment of your visitors who clicked on the “start the checkout” button but never actually placed an order.
In the physical-world metaphor, this is the shopper who fills the cart with groceries, stands in the checkout lane but never actually completes a purchase.
Why does the checkout abandonment rate matter?
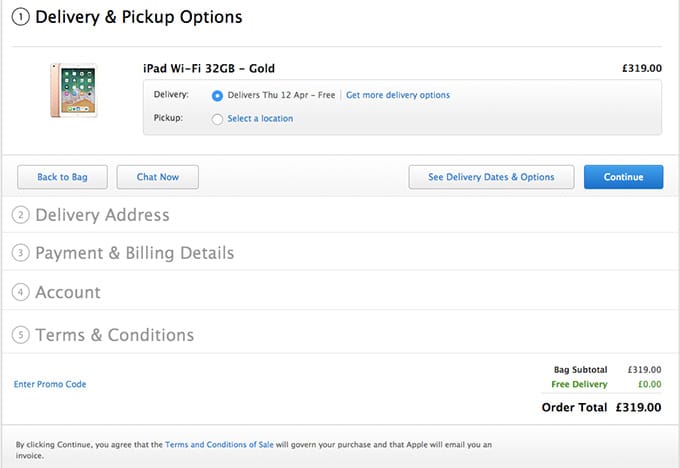
Image Source:applecheckout
Checkout abandonment rate is related to the second most important group of site visitors: Visitors who are ready to convert (but did not convert). These visitors send strong signals of intent: They locate the product; They click on the add to cart button; They view the cart page, and they start the checkout process.
What does the checkout abandonment rate measure?
Cart abandonment rate is a clear indication of either: a broken checkout process or a broken promise to the visitor.
To identify the issues that prevented visitors from converting, I would highly recommend:
- Conduct online polling with a focus on barrier questions (what prevented you from converting?)
- Conduct usability studies and analyze how many clicks it took visitors to complete the checkout, how long it took them to go through it, and what errors did they encounter
- Watch session replay videos for that visitor segment
- Conduct form analysis on your checkout forms
- Analyze checkout heatmap data
- Conduct one-on-one interviews with customers who converted to ask them if they encountered problems during the checkout.
“Guest checkout with optional registration on e-commerce sites simplifies the purchase process and invites users to register when they feel comfortable, rather than forcing unwanted registration.”
What are the average checkout page abandonment rates?
Based on an analysis of over 300 e-commerce sites with annual revenue ranging from 10 to 75 million dollars per year, the average desktop checkout abandonment rate is between 25% to 35%.
Mobile abandonment rates have a very high variance, but for most, they are up to 30% higher than the desktop version.
Case study: Odd high abandonment rates
A recent Fortune 500 client of ours reported a checkout abandonment rate close to 95%.
Yes, 95% of the visitors who started the checkout process, ended up abandoning the checkout by the 2nd page. After some quick analysis, we realized that users got stuck on the 2nd page because the site did not allow for anonymous checkout and forced visitors to create an account and fill a password for it. While this could hinder the conversion process, at the surface, it did not explain the 95% abandonment rate.

We tried to go to the checkout ourselves.
The password configurator required what our client’s technical team considered “highly secure” passwords that were made up of 9 random characters. No matter what combination of letters we tried, the password was rejected.
I am sure that the technical team thought they were doing a good job putting this requirement. The abandonment rate told a different story. We demanded the technical team relax the password requirements. We were so sure of this fix that it was deployed without any A/B testing on the site. With the new less strict policy in place, the checkout abandonment rate dropped to 28%.
Further suggested reading
- You can also review detailed cart page best practices based on an analysis of the top 200 e-commerce sites.
- A case study showing how we improved cart conversion rate by 17.75%.
- Best practices guide with strategy and tactics on reducing cart page abandonment.
- Understanding the reasons why visitors leave and abandon your site
- Using Persuasion At Every Stage In The E-commerce Conversion Funnel
- Optimizing ecommerce conversion funnels including interviews with 4 CRO experts