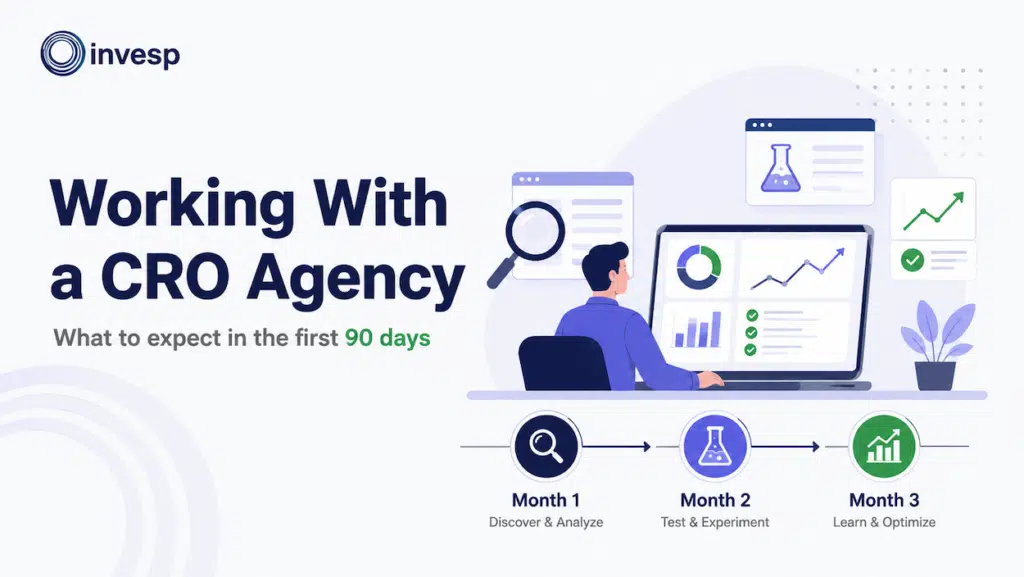


Hiring a CRO agency does not mean spending Month 1 staring thoughtfully at heatmaps, Month 2 changing a button color, and Month 3 celebrating a suspiciously neat 27% uplift.
The first 90 days are much messier than that. Research, testing, analytics, customer feedback, design, and development all overlap, and at Invesp, the first experiment can sometimes go live within a week while deeper research continues in parallel.
For this article, I spoke with one of Invesp’s senior CRO specialists and reviewed real client research, experiment briefs, designs, and results to show what happens from kickoff to Day 90, including a losing test that changed what the team investigated next.
Here’s what three months when you start working with a CRO agency really look like.
Before the work starts: Give the CRO team what it needs to move quickly
This is a less exciting stage involving permissions, old research, brand guidelines, and figuring out who actually owns the GTM account.
Still, getting this part right matters. When I asked Medha Dhriti Dutt, one of Invesp’s senior CRO specialists, what she needs from a new client, her answer was essentially, “give us everything you already know before we spend time discovering it again.“
That usually means having these ready:
- Analytics and tracking: GA4 (or your analytics platform), GTM, and relevant dashboards
- Experimentation: your A/B testing platform and previous test results (wins, losses, and inconclusive tests)
- Existing research: heatmaps, session recordings, UX research, surveys, and NPS data
- Customer insight: for lead-gen companies, even recordings of sales calls from both deals that closed and deals that didn’t
- Marketing context: ad-platform access where the team needs to compare ad messaging with the landing page
- Brand and people: brand guidelines, main competitors, and the people who can approve designs, development, or tracking changes
That lost-sales-call point is particularly useful. Analytics can tell you that people aren’t converting.
A prospect saying, “I don’t understand how this works for a company our size” can tell you what the CRO team may need to investigate next. Medha says Invesp uses those calls specifically to uncover customer pain points and objections.
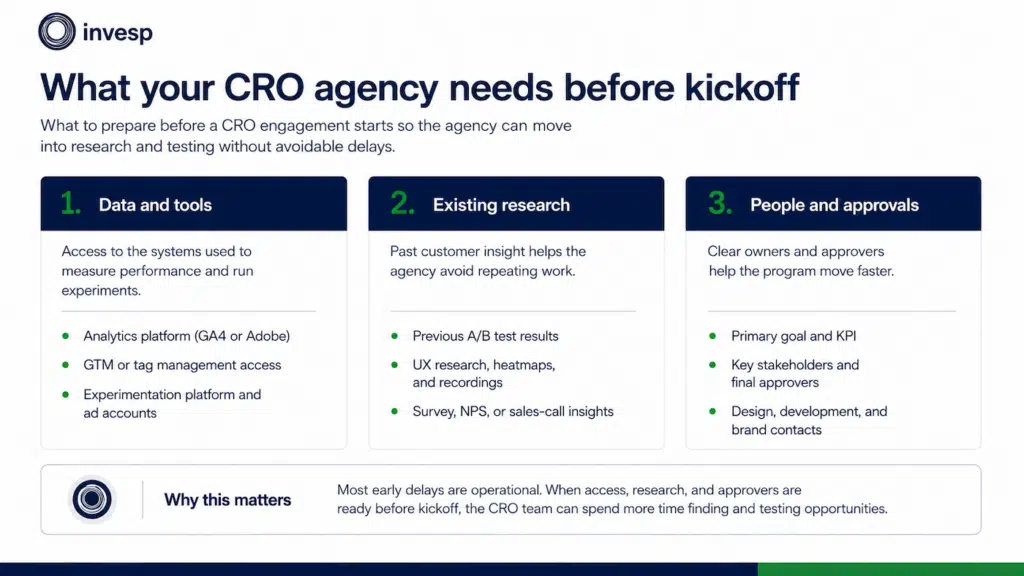
CRO agency kickoff checklist covering data access, research, tools, and key approvers.
One thing that can still slow the first test down is not having an experimentation platform ready. If the agency is waiting on tool selection, contracts, or setup, the test can be ready before the infrastructure is.
Month 1: Testing starts while the agency looks for the bigger problems
In Month 1, testing and research can start together.
When I asked Medha how quickly a new client might see something live, I initially guessed a month.
She corrected me, “The first test can sometimes be live within a week.“
The first test can go live while deeper research is still underway
Those first experiments aren’t based on three weeks of account-specific research. They’re usually opportunities the CRO team can identify from its initial review and experience across other sites.
For example, for one lead-gen client:
- The hero didn’t clearly explain why someone should choose the company;
- Two CTAs competed for attention;
- The more prominent CTA wasn’t attached to the offer the business most wanted visitors to pursue.
The team tested stronger value-proposition messaging and changed the emphasis between the offers.
But if the problem seems obvious, why bother testing it?
Because even an experienced CRO team is still making an assumption until customers react to the change. Controlled experimentation gives the team a way to test that assumption instead of quietly turning an educated guess into the new website.
And the test itself can become research. If visitors respond differently to two messages or ways of presenting an offer, you’ve learned something about what matters to them.
These early tests usually run alongside analytics analysis, session recordings, heatmaps, and other research.
The agency looks for where customers are dropping out
While those early tests are moving, the deeper investigation starts with a simple question:
Where in the customer journey are we losing people?
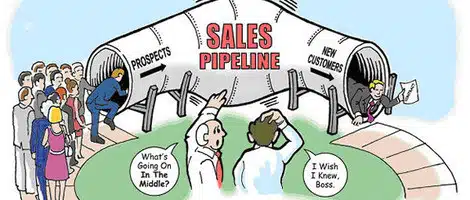
Somewhere between “prospect” and “customer” is usually where things get interesting.
The CRO team looks at how visitors arrive, which pages or steps they reach, and where large numbers disappear before completing the action the business cares about.
This is essentially what funnel and traffic analysis means in practice.
They might look at:
- Which landing pages bring in visitors who actually convert (homepage, campaign pages, product pages)
- Where people abandon the journey (product → cart, form start → submission, demo page → booking)
- Whether mobile and desktop visitors behave differently (for example, a much higher mobile drop-off)
- Whether some traffic sources perform much better or worse than others (paid search, organic, social, email)
- Which drop-offs are large enough to matter commercially (high-traffic pages, expensive acquisition channels, key revenue steps).
This is where one of the ecommerce experiments our CRO team showed me started getting interesting.
A product detail page had received 47,205 visits, but only 4,197 visitors added the product to cart, an 8.9% add-to-cart rate.
So something was happening between:
“I’m looking at this product.”
and
“I’ll put it in my basket.”
The numbers could show the gap.
They couldn’t tell us what was causing it.
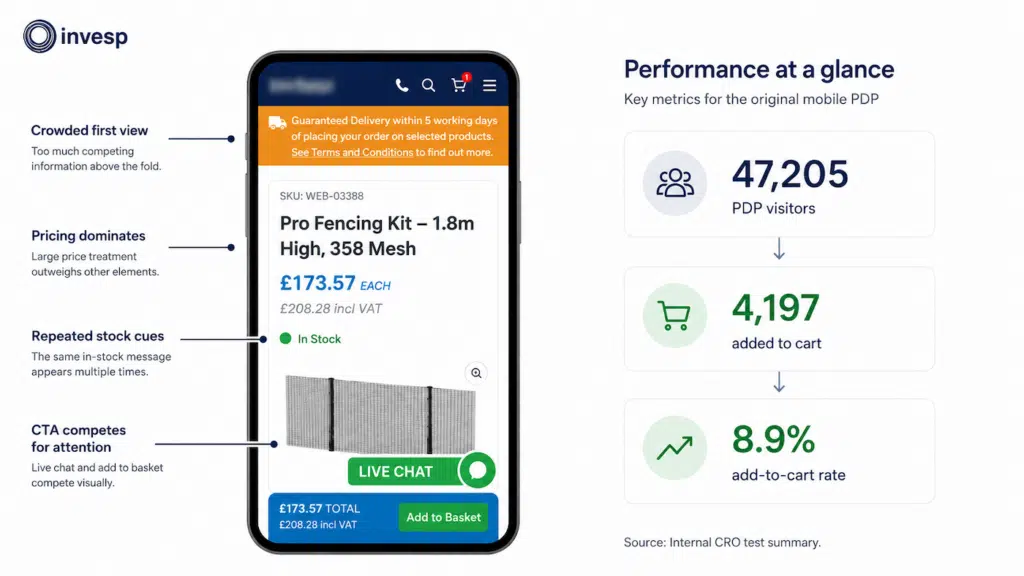
The original mobile product page the team began investigating.
And looking at the page certainly gave the team plenty of suspects.
Above the fold alone, visitors had the product name, SKU, two versions of the price, repeated stock messaging, delivery information, product imagery, live chat, and the add-to-basket CTA all asking for attention.
So “there’s too much going on here” was a reasonable first theory.
Behavioral research starts investigating why those gaps exist
Once the numbers show where something appears to be going wrong, the agency starts looking for evidence that explains why.
Depending on the business, that research can include:
- Session recordings
- Heatmaps
- On-site polls
- Customer surveys or NPS responses
- Sales-call insights
- Previous UX research
- Previous experiment results
For example:
Analytics: lots of people view the product page, but few add the product to the cart.
Session recordings: visitors keep scrolling through the page and looking for product details before leaving.
Customer feedback: shoppers say they’re unsure whether the product is right for what they need.
Put those together, and the problem starts to look more specific:
People may not be adding the product to cart because they can’t easily find the information they need to decide whether it’s right for them.
Now the agency has something much more useful than “this page converts badly.”
The agency checks whether the numbers are trustworthy
Before analytics starts shaping the testing roadmap, the CRO team needs to know whether the data is believable.
In one recent client engagement, a simple comparison showed a major gap:
- Client’s booking system: 70,000+ bookings
- GA4: roughly 31,000 purchase events
Those two systems won’t always match perfectly. But when analytics is recording less than half of the transactions the business says actually happened, the agency needs to understand why before using that data to judge pages, campaigns, or experiments.
The agency then needs to determine whether the gap comes from different definitions, missing tracking, or checkout paths not being recorded properly.
The agency also flags problems that don’t need an experiment
During Month 1, the CRO team may also run a site quality assurance check to catch problems that are simply broken, not debatable.
Think: a CTA that doesn’t work on mobile, a form that won’t submit properly, or page elements overlapping and making something unusable.
So the agency flags those for the client to fix and reserves experiments for changes where the outcome genuinely needs to be tested, like different messaging, page layouts, or ways of presenting an offer.
The team reviews key pages for points of confusion
The agency also goes through the site’s most important pages and asks practical questions such as:
- Is it immediately clear what this page is offering?
- Can visitors find the information they need to make a decision?
- Is the next step obvious?
- Are important details buried or competing with less useful information?
- Is anything likely to create unnecessary hesitation?
This type of expert review is often called a heuristic analysis.
In the process described to me, the team puts key pages into a Figma board and reviews them together. Each person adds observations, and the team compares them with what the agency is seeing in analytics, recordings, polls, and other customer research.
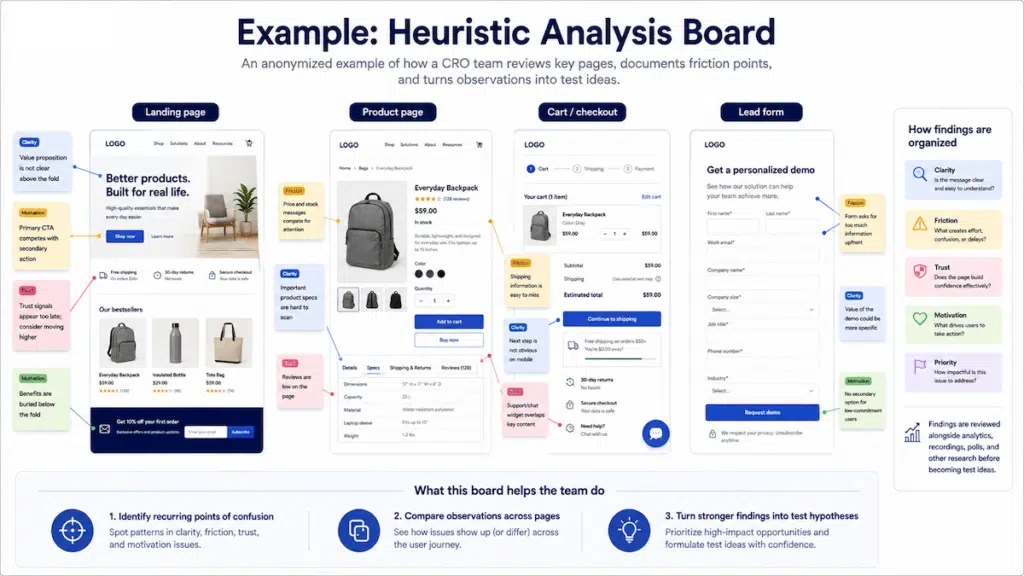
An anonymized heuristic-analysis Figma board example
When the page review, customer behavior, and analytics point to the same issue, the agency has a strong reason to test it.
The first research-backed hypotheses start taking shape
By this point, the agency should be moving from “something is going wrong here” to a much more specific explanation of what might be causing it.
Take the product-page example.
The team already knew that only 8.9% of product-page visitors were adding the product to cart. After reviewing the page and the supporting research, the working theory became much clearer – customers may have been dealing with too much information at once before they could decide what to do next.
That gave the team something concrete to test.
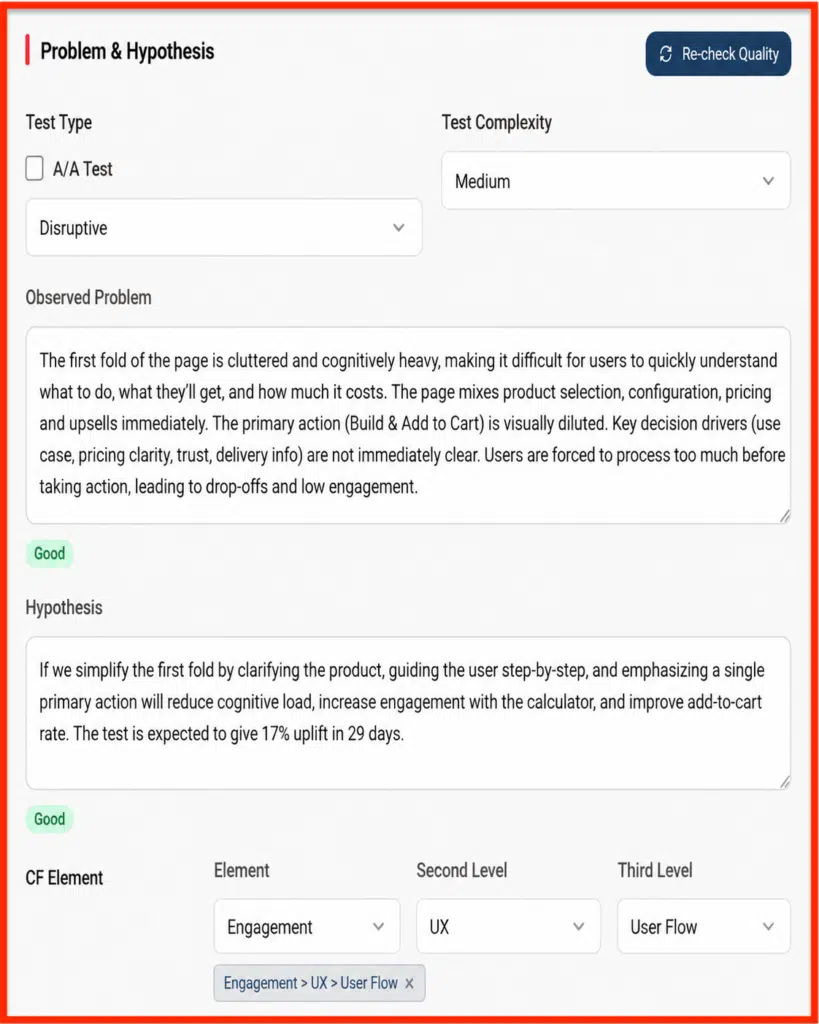
The problem and hypothesis recorded before the PDP experiment was developed.
If you’re paying an agency to run CRO, you should be able to see why each experiment is being run.
The team wasn’t redesigning the PDP just because it looked busy. There was a measurable drop between viewing the product and adding it to the cart, and the team had a clear idea of what might be causing it.
Month 2: The research starts shaping what gets tested next
By Month 2, testing should already be underway. What changes now is that more of the experiments come directly from what the agency learned about your customers and conversion problems in Month 1.
The agency decides which problems are worth testing first
A month of research can produce far more potential problems than anyone has the time (or development budget) to test immediately.
So the agency has to choose.
For each opportunity, it should be asking things like:
- How many customers does this affect?
- How close is the problem to revenue, purchases, or qualified leads?
- How strong is the evidence that the problem is real?
- Is there enough traffic to test the change properly?
- How much design and development work will it require?
The agency is deciding which problems matter most, which have the strongest evidence behind them, and which can be tested without wasting time or budget.
The hypothesis gets turned into something the team can actually build
Month 1 gave us a hypothesis for the product-page example:
The first part of the page may be asking customers to process too much information before they can confidently take the next step.
Now that needs to become an actual experiment.
That means getting more specific about:
- What will change on the page
- Which visitors will see the variation
- What customer action the experiment is trying to improve or the prominent CRO KPIs to focus on
- Which other behaviors are worth watching
- How the team will know whether the change helped
The experiment brief for our product-page test, for example, included three questions:
- Will more visitors add products to cart?
- Will visitors scroll further and engage more with the product page?
- Will average time on the page change?
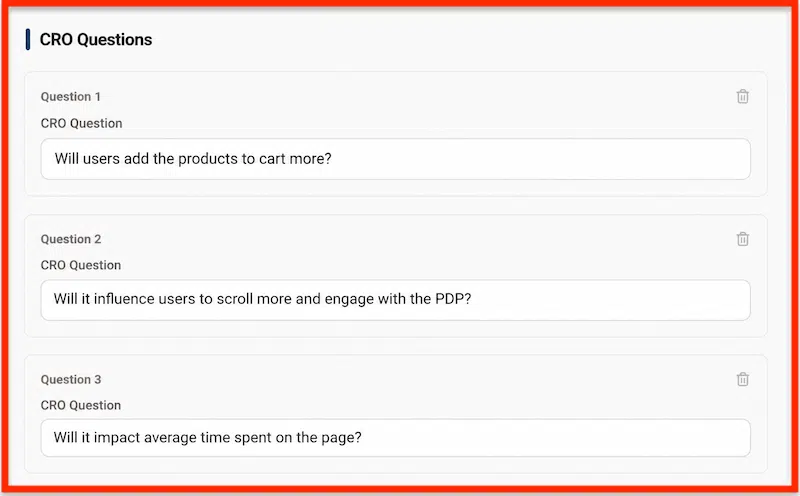
The experiment brief documented the behaviors the team wanted to measure before the test was built
The design should solve the problem the hypothesis identified
Next comes the part clients can actually see: the variation.
For the product-page experiment, the team wasn’t simply told to “make it cleaner.” The design needed to address the specific problem identified during the research.
So the variation changed things including:
- The order in which product information appeared
- How the product name, rating, SKU, and pricing were presented
- Duplicated stock messaging
- The product-gallery controls
- Navigation to product information and specifications
- The main and sticky add-to-basket CTA
- The position and behavior of the live-chat widget
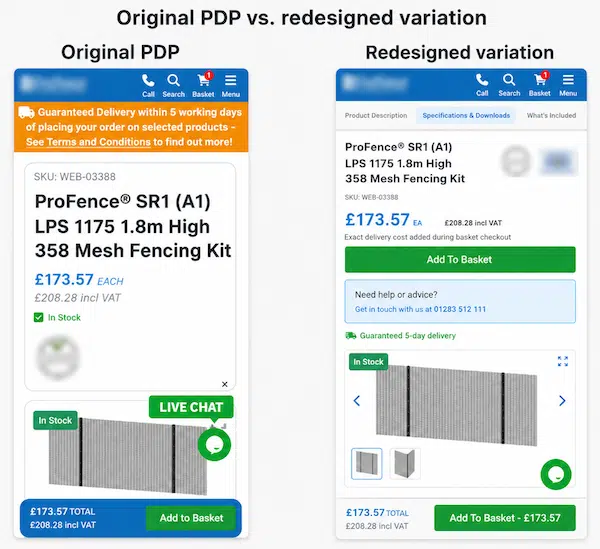
The original product page and the variation built from the Month 1 hypothesis
The client should be able to trace the design decisions back to the original problem.
Problem: too much competing for attention.
Hypothesis: simplify the first experience and make the next action clearer.
Variation: reorganize the information and reduce competing elements.
That’s what a research-backed experiment should look like in practice.
The test still has to get through development, approval, and QA
A typical experiment has to move through something like:
Experiment brief → Design → Client approval → Development → QA → Tracking check → Launch
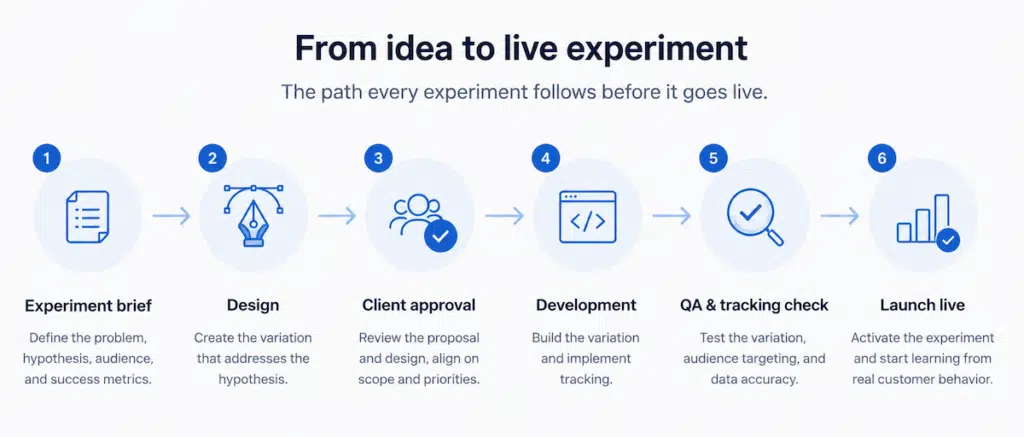
Experiment workflow from brief and design through approval, development, QA, tracking, and launch
Timelines can also vary.
A simple copy change may move quickly. A larger product-page redesign can take longer because it needs more development, approvals, and testing before launch.
Then there is QA (quality assurance). The team checks that the variation displays correctly, reaches the right visitors, tracks the right events, and hasn’t broken anything else.
Research keeps running while the CRO team builds more experiments
Month 2 doesn’t mean the research team closes all 37 browser tabs and declares that part finished.
Different workstreams keep moving at the same time.
Based on the process Invesp’s CRO professionals described, that can include:
- Reviewing new session recordings
- Adding new findings from the site review
- Reviewing competitors
- Preparing the next experiment briefs
- Competitor analysis
Competitor analysis doesn’t mean copying whatever another company is doing. The agency looks at how comparable businesses explain products, handle objections, or present important information and uses anything useful as another clue when deciding what to investigate.
For example, at Invesp, the team puts useful competitor examples into a shared Figma board, reviews them together, and uses anything relevant as one more input when deciding what to test next.
By Month 2, several experiments should be moving at the same time
One of the more useful things Invesp’s CRO team told me was that the aim is to keep experiments moving rather than waiting for one to finish before thinking about another.
At this point, one test may be live, another may be in QA, another in development, while the team is still researching what should come after them.
That distinction matters if you’re the person approving the CRO budget.
Not everything you’re paying for will be visible as a live website change on a particular Tuesday. Some experiments are running, some are being built, and others are still being researched, so there is something worthwhile to test after the current batch finishes.
And our product-page hypothesis has now traveled from:
8.9% add-to-cart rate → suspected problem → documented hypothesis → redesigned experience → live experiment.
The next question is the one that matters most:
Did the change actually solve the problem the team thought it had found?
That’s where Month 3 begins.
Month 3: Results start changing what the agency tests next
By Month 3, some early experiments should have results, and the agency should use those findings to decide what to investigate and test next.
A test can win, lose, or tell you very little
Not every experiment ends with a celebratory conversion graph.
Broadly, you’ll see three types of result:
- Win: the variation performs better on the outcome the team was trying to improve.
- Loss: the variation performs worse, or the expected improvement doesn’t appear.
- Inconclusive: there isn’t enough evidence to confidently say the variation made a meaningful difference.
A good CRO program has to be useful in all three cases.
And our product-page experiment is a good example of why that matters.
The product-page redesign didn’t improve conversion
The product-page experiment we’ve been following ended up being a good example of the second outcome.
The idea was simple: make the top of the page less cluttered, organize the information better, and see if more people add the product to cart.
They didn’t.
But while the test was running, the team also watched session recordings in FigPii and looked at what people were actually doing on the page.
And that gave them a much better clue.
Visitors kept spending time on the product specifications and description. For a product like this, people seemed to care less about whether the page looked cleaner and more about getting enough information to decide, “Is this actually the right product for me?”
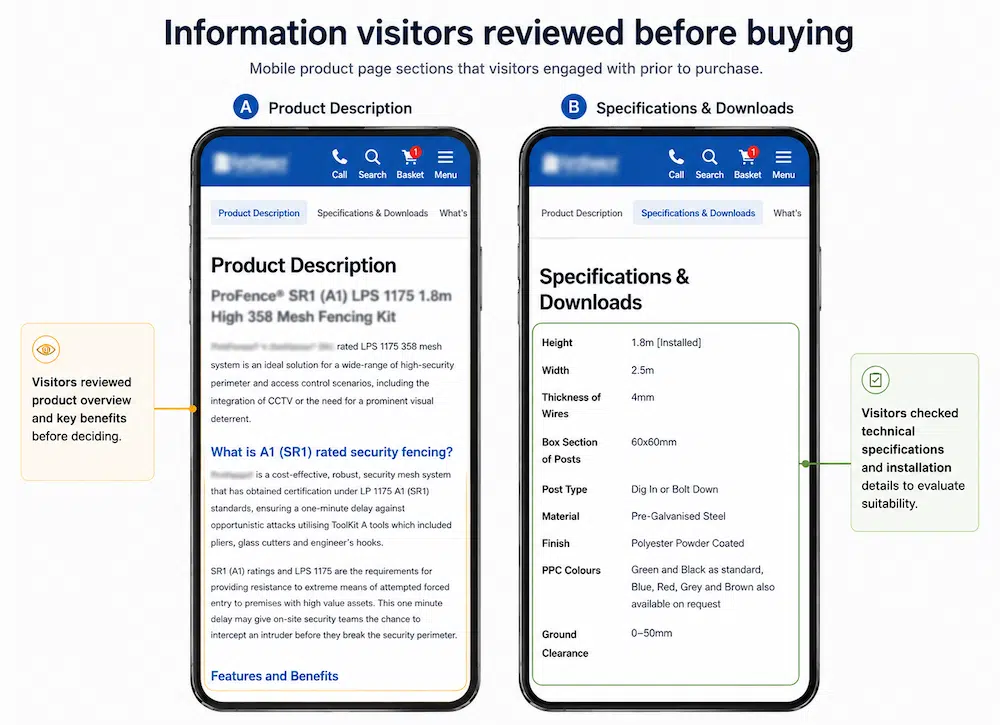
Session recordings and interaction data pointed the team toward the product information customers were trying to find
So the thinking changed:
- What the team thought: the page was too cluttered.
- What the test showed: cleaning up the layout wasn’t enough.
- What they learned: customers may need better access to product information before they’re ready to buy.
Invesp’s senior CRO specialist, Medha, told me this result changed the direction of the work. Rather than continuing to focus on making the PDP look cleaner, the team started looking at how to make the important product information easier to find.
This’s why a losing test isn’t automatically wasted money.
It can rule out one explanation and make the next one more precise.
The next experiment should reflect what the last one taught the agency
By this point, you should start seeing a clear link between one experiment and the next.
A result might lead the agency to:
- Test a different solution to the same problem
- Move a newly discovered problem higher up the list
- Drop an idea that now looks less important
- Look more closely at a particular customer group
For the PDP example, the path looked like this:
Large add-to-cart drop-off
↓
Suspected information overload
↓
Tested a simpler page hierarchy
↓
No meaningful conversion improvement
↓
Session recordings showed customers looking for detailed product information
↓
Next focus: make that information easier to find
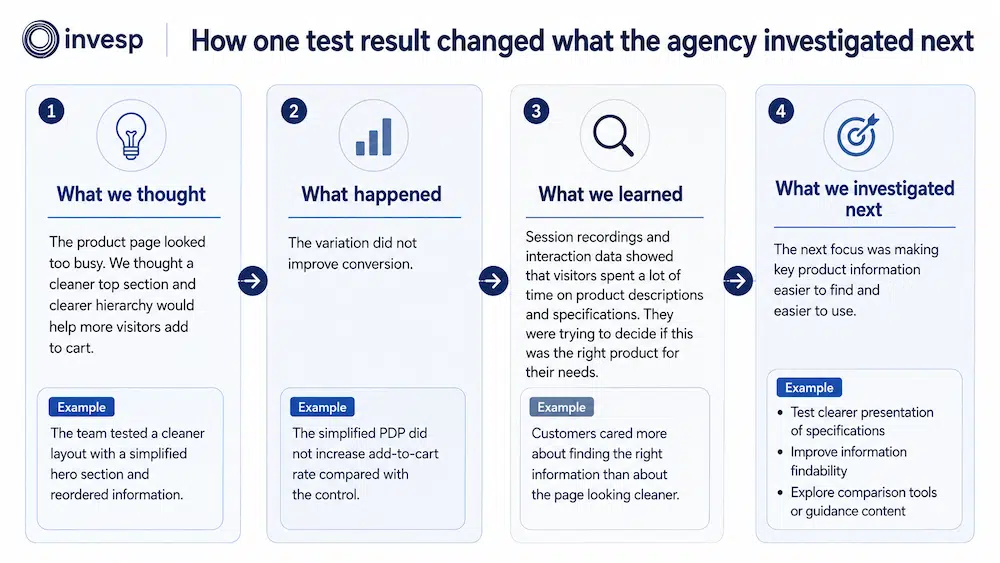
CRO test showing how a failed redesign led the team to investigate product information needs
That’s a much better way to judge progress than simply asking how many tests won. By Month 3, you should be able to see how what the agency learns from one round of testing is shaping the next.
What should you have after 90 days with a good CRO agency?
By Day 90, you shouldn’t just have a folder full of test screenshots.
You should have:
- The testing volume you agreed on. If the engagement was for two tests a month, that’s roughly six tests launched; three a month, roughly nine.
- A much clearer picture of where customers struggle. By this point, the agency should have findings from analytics, session recordings, polls, heuristic reviews, competitor research, and the experiments themselves.
- A better idea of what is actually worth fixing. The team should be able to name the main customer problems instead of running a collection of unrelated tests.
- A stronger plan for what comes next. The next few months of testing should reflect what the first three months taught the team.
The simplest way to judge those first 90 days is this: Do you understand your customers better, have you tested meaningful ideas, and do you know why you’re testing what comes next?
If the answer is yes, your CRO program is doing more than keeping the testing tool busy.
If you’re investing in CRO, you should be able to see where the money is going and why.
Talk to the Invesp team about building a program around the opportunities most likely to move revenue, leads, and customer value.
FAQs about the first 90 days with a CRO agency
How soon should a CRO agency launch the first test?
It depends on your setup, but the first test doesn’t necessarily take a month. At Invesp, an early experiment can sometimes go live within the first week while deeper research continues in parallel.
How many A/B tests should run in the first 90 days?
That depends on the testing volume agreed in the engagement. In the process Medha described, two tests per month would mean roughly six launches over three months; three per month would mean roughly nine.
Should I expect revenue gains within the first 90 days?
You may see winning tests, but I wouldn’t make a specific revenue lift the only measure of whether the first 90 days worked. By then, you should also have a much clearer understanding of the biggest customer problems, evidence from research and experiments, and a stronger plan for where to focus next.
What can slow down a CRO agency in the first few months?
Missing analytics access, unreliable tracking, slow approvals, development constraints, or not having an experimentation platform ready can all delay launches. Invesp’s CRO team specifically called out testing-tool setup and client approvals as factors that can slow things down.