There’s one thing that’s important to every C-suite/decision-maker across industry and niches.
More conversions (increased sales, sign-ups, event attendees, etc.)
To get more conversions, some folks believe you need to spend more on customer acquisition.
This works until you realize you’re spending a lot of your marketing budget on acquisition and nothing else.
Enter in conversion rate optimization.
With CRO, you don’t need to drive more traffic to your site to get more conversions, but put things in place that ensure you’re converting more of your existing traffic.
In this article, I’ll highlight 30 of the most important conversion rate statistics ranging from average conversion rates across niches, benchmarks, etc.
Let’s get started.
General Conversion Rates
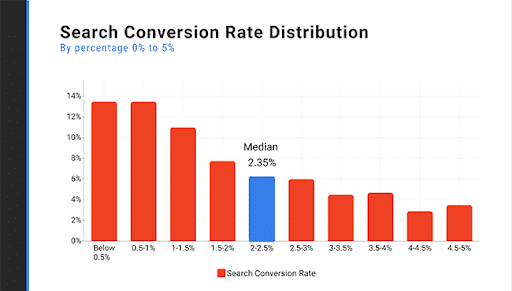
1. The average conversion rate for websites is 2.35%
Conversion rates vary across industries, but taking the average across several niches, the number sits at 2.35%. This means if your website is converting at the 2-3% mark, you’re doing okay (on a broad scale)
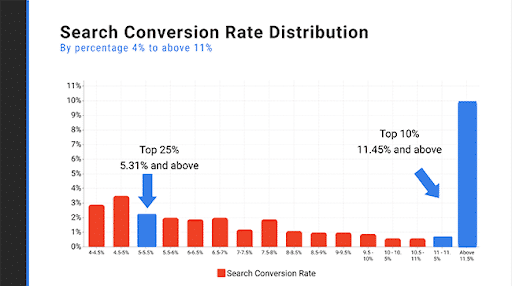
2. Top websites have a conversion rate of 11% or more
Converting at 2 – 3% is fair if you’re just starting out, if you want to play in the big leagues, the top 10% of websites convert at 11% and above.
This means you need to roll out a CRO strategy and implementation plan to achieve that.
3. Food & Beverage is the industry with the highest conversion rate at 7.9%.
Conversion rates differ by industry, and the food/beverage industry takes the cake here (pun intended)
4. The highest B2B average conversion rate by industry is professional services (4.6%)
In B2B, the professional services industry have the highest conversion rates at 4.6%.
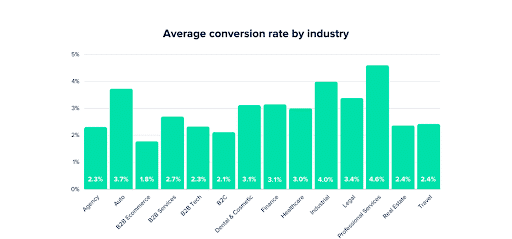
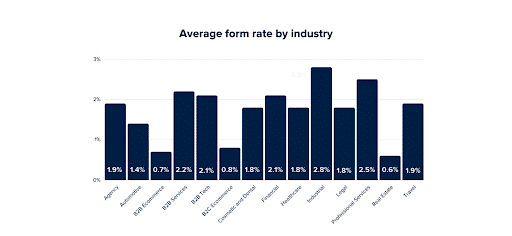
5. The B2B industry with the highest form rate conversion is industrial at 2.8%
Online forms are a big part of any website (to collect leads, to get sign ups, etc) The industrial niche has the highest conversion rate.
Effect Of Factors On Conversion Rate
6. Slow loading pages reduce conversions by 7%
If you thought site speed only mattered for SEO, think again. Just a 1-second delay in your site loading time can hurt your conversions by up to 7%.
7. Companies spend just $1 on conversion rate optimization for every $92 spent on customer acquisition
This shocking statistic highlights just how huge the gap is between the amount we spend on getting traffic and the amount we spend turning that traffic into customers. Many businesses are spending too much on traffic and not enough on conversions. Double your conversion rate, and you can afford to half your traffic.
8.Increasing your number of landing pages from 10 to 15 increases leads by 55%
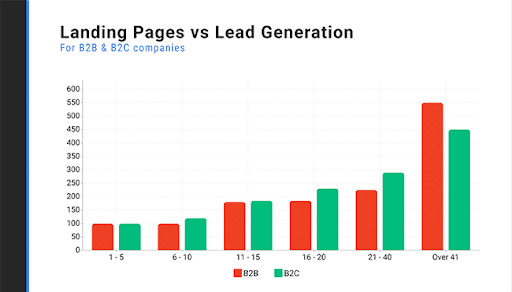
Making landing pages for each of your campaigns is good practice. Businesses that do this, convert more of their traffic to leads.
9. If you want to build a good conversion rate for your Google Ads campaigns, go for a conversion rate higher than 5.31%. For perspective, the top 25% of companies advertising with Google Ads maintain a conversion rate of 11.45%.
10. When you include a video on your landing page, it can increase your conversion rates by up to 80%.
11. ¼ of companies cite rapid improvements in technology as their greatest barrier to improving conversion rates.
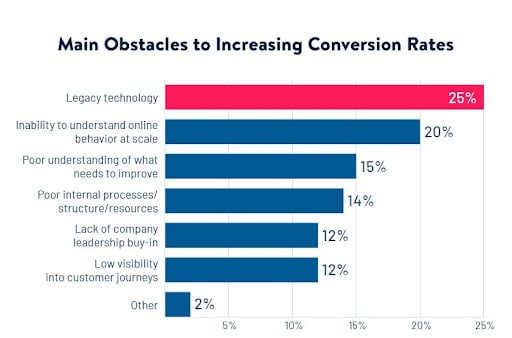
While increasing their website conversion rates, most organizations struggle to adopt novel technologies, while 20% had problems in understanding online behavior at scale, and 20% in understanding points of improvement.
12. CTAs used as anchor text in blogs improve conversion rates by up to 121 percent more than banner ads.
A decade ago, banner ads proliferated the internet. They were so ubiquitous that most people just tend to tune them out because they got used to seeing so many of them online. This is a phenomenon called “banner blindness” and is one perfect reason why your CTAs are much better integrated into anchor text.
13. Sales/Qualified Leads is the most popular sales conversion rate calculation.
The majority of marketers (about 35%) divide the number of sales to qualified leads as the best way to calculate their lead conversion rate. Other popular methods include dividing the number of sales into the total number of leads (32%), contacted leads (11%), and opportunities (10%), sales conversion rate statistics further reveal.
14. Only 39.6% of firms have a documented CRO strategy.
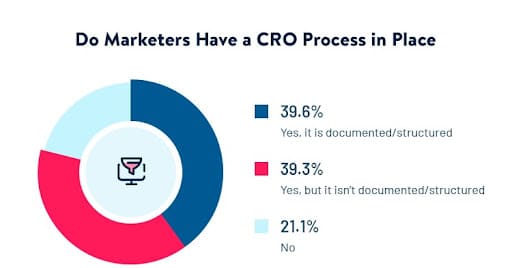
39.3% do follow a process but have yet to structure and document it, and one in five marketers reported not following a CRO process at all. As a research-oriented and data-driven approach, CRO works the best when its stages are structured rather than handled reactively and positioned within the larger marketing efforts efficiently.
Conversion Rate By Channels
15. Organic search leads as the channel with the highest conversion rate at 16% followed by Amazon at 10-15%
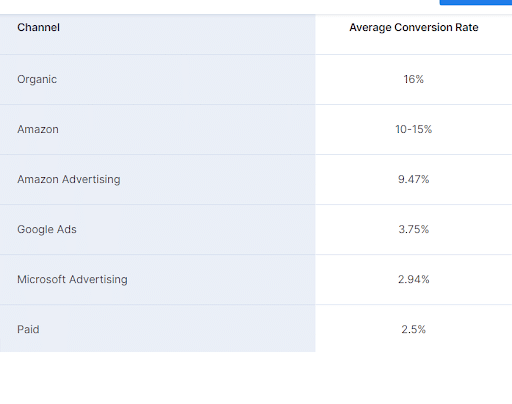
Depending on your type of business, you now know where to focus your marketing efforts for the best ROI.
Testing and Optimization
16. 46.9% of optimizers run one or two tests a month.
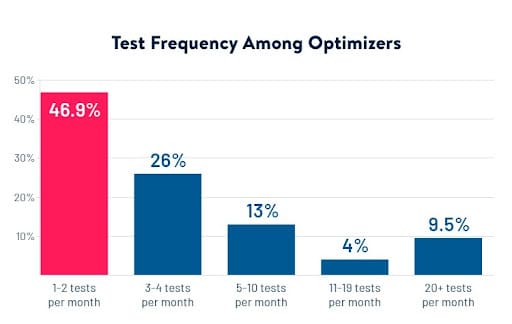
Running up to a couple of tests per month is the most common test velocity among professionals, and about 9% of optimizers run more than 20 tests a month. Running client-side tests are the most popular at 55%, while 17% run server-side tests and 27% do both, conversion rate optimization stats reveal. A/B tests are the most popular types, used by almost all optimizers surveyed. A little over one-third also tests more than one variation.
17. Less than 0.11% of the total websites online are using CRO tools or running tests.
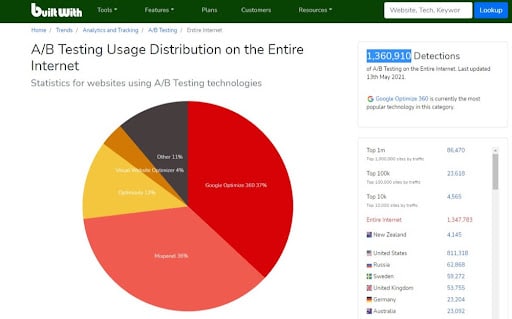
According to Builtwith, a tool that tracks the software that websites are using, they can only find 1,110,585 sites using CRO testing tools at this time.
18. The United States is the country with the most number of sites running A/B tests (520,415 websites)
19. Google Optimize is the platform leading with the most usage distribution on the internet (578, 779 websites)
Industry-Specific Conversion Rates
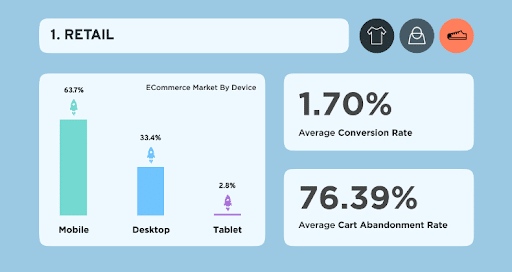
20. The retail Industry has a conversion rate of 1.70%, an average cart abandonment rate of 76.39% and mobile is the most used device at 63.7%.
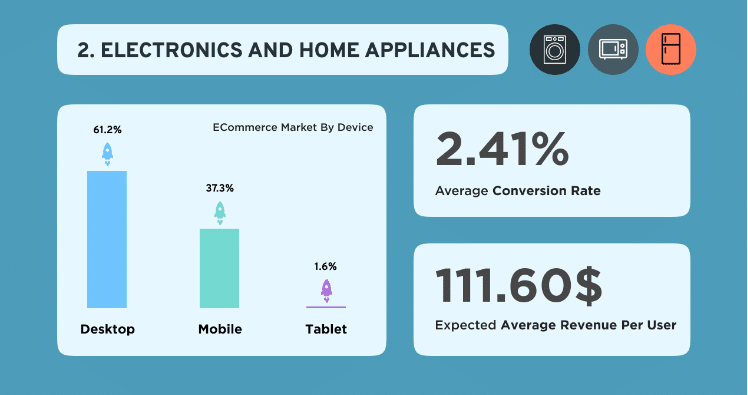
21. The electronics and home appliances Industry has a conversion rate of 2.41%, an expected average revenue per user of $111.60 and desktop is the most used device at 61.2%.
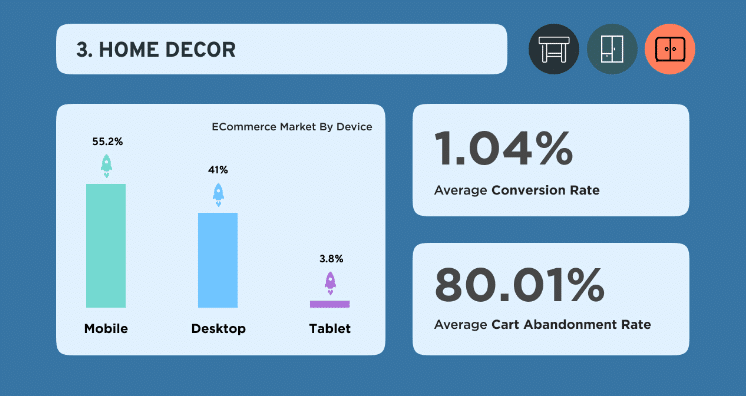
22. The home decor Industry has a conversion rate of 1.04%, and an average cart abandonment rate of 80.01% and mobile is the most used device at 55.2%.
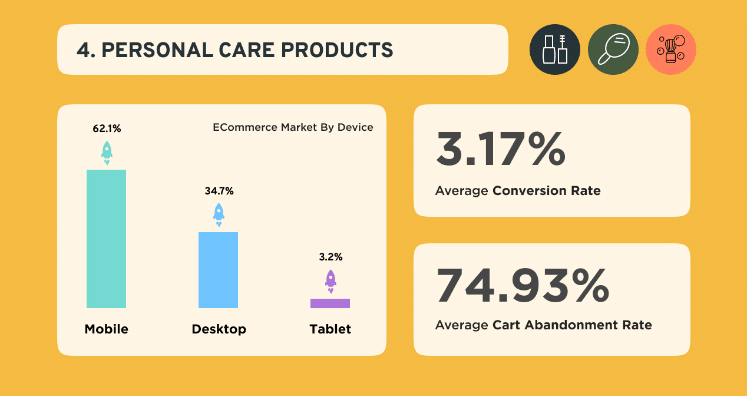
23. The personal care products Industry has a conversion rate of 3.17%, and an average cart abandonment rate of 74.93% and mobile is the most used device at 62.1%.
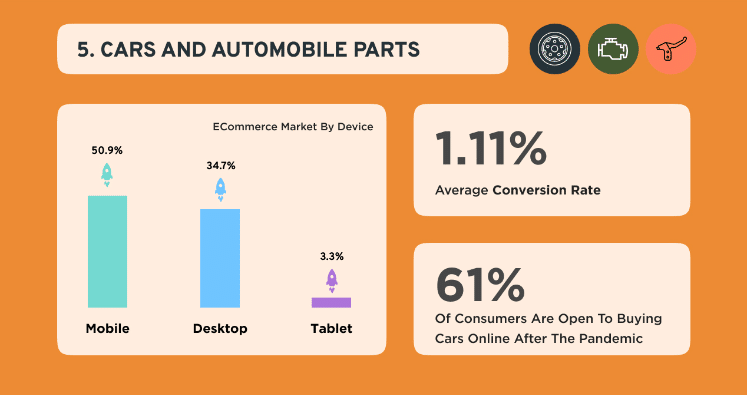
24. The home decor Industry has a conversion rate of 1.11%, and 61% of consumers are open to buying cars online post-pandemic and mobile is the most used device at 50.9%.
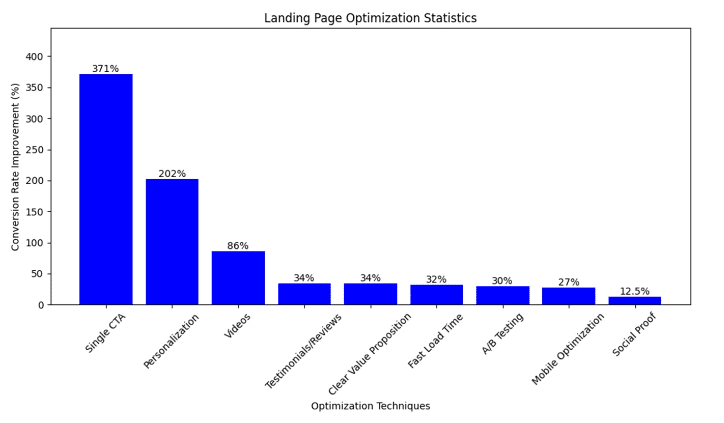
Landing Page Optimization – CRO Statistics
25. The average landing page conversion rate across industries is 2.35%.
26. Landing pages with a single call-to-action (CTA) can increase conversions by 371%.
27. Using videos on landing pages can increase conversions by 86%.
28. Including testimonials or reviews on landing pages can increase conversions by 34%.
29. Landing pages with a clear value proposition have a 34% higher conversion rate.
30. Mobile-optimized landing pages can improve conversion rates by 27%.
31. Landing pages with a load time of fewer than 3 seconds have a 32% higher conversion rate.
32. A/B testing of landing pages can lead to a 30% improvement in conversion rates.
33. Using social proof, such as displaying the number of customers or subscribers, can increase conversions by 12.5%.
34. Personalized landing pages for different audience segments can increase conversions by 202%.
Mobile Optimization
35. “There are over one billion tablet users worldwide.
36. 55.4% of internet users use mobile phones to buy online.
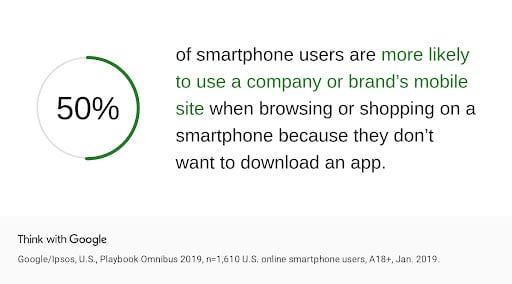
37. 50% of smartphone users are more likely to use a mobile site when browsing or shopping because they don’t want to download a mobile app.
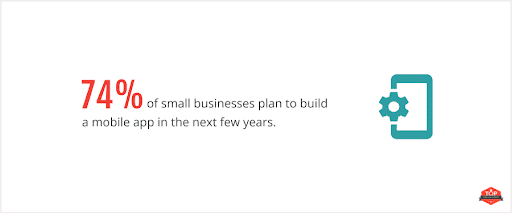
38. 74% of small businesses are planning to build a mobile app in the next few years.
39. 88.5% of web designers think that slow loading is a top reason why visitors leave a website.”
40. Another 73.1% think that non-responsive web design is a top reason for visitors bouncing from a website.