Attention marketers, salespeople, and entrepreneurs—there’s a vital goal that unites us all:
Achieving more conversions!!!
Whether it’s increased sales, sign-ups, event attendees, or other valuable actions, driving higher conversion rates is paramount.
While some may initially focus on increasing customer acquisition budgets, this approach can quickly consume your marketing resources without guaranteeing sustained growth.
That’s where Conversion Rate Optimization (CRO) steps in.
CRO is about maximizing the potential of your existing traffic by fine-tuning your website and strategies to ensure more visitors take desired actions.
In this article, I’ll uncover 30 crucial conversion rate statistics.
From industry benchmarks to average rates across niches, these insights will arm you with the knowledge to optimize your site conversion strategies effectively.
Let’s dive in and harness the power of CRO…shall we?
1. The average conversion rate for websites is 2.35%
Conversion rates vary across industries, but taking the average across several niches, the number sits at 2.35%. This means if your website is converting at the 2-3% mark, you’re doing okay (on a broad scale)

2. Top websites have a conversion rate of 11% or more.
Converting at 2 – 3% is fair if you’re starting out, if you want to play in the big leagues, and if the top 10% of websites convert at 11% and above.
This means you need to roll out a CRO strategy and implementation plan to achieve that.

3. Food & Beverage is the industry with the highest conversion rate at 7.9%.
Conversion rates differ by industry, and the food/beverage industry takes the cake here (pun intended).

4. The highest B2B average conversion rate by industry is professional services (4.6%)
In B2B, the professional services industry has the highest conversion rates at 4.6%.
 5. The B2B industry with the highest form rate conversion is industrial at 2.8%
Online forms are a big part of any website (to collect leads, to get sign-ups, etc). The industrial niche has the highest conversion rate.

If you thought site speed only mattered for SEO, think again. Just a 1-second delay in your site loading time can hurt your conversions by up to 7%.
7. Companies spend just $1 on conversion rate optimization for every $92 spent on customer acquisition.
This shocking statistic highlights just how huge the gap is between the amount we spend on getting traffic and the amount we spend turning that traffic into customers. Many businesses are spending too much on traffic and not enough on conversions. Double your conversion rate, and you can afford to half your traffic.
8. Increasing your number of landing pages from 10 to 15 increases leads by 55%.

Making landing pages for each of your campaigns is good practice. Businesses that do this convert more of their traffic to leads.
9. If you want to build a good conversion rate for your Google Ads campaigns, go for a conversion rate higher than 5.31%. For perspective, the top 25% of companies advertising with Google Ads maintain a conversion rate of 11.45%.
10. When you include a video on your landing page, it can increase your conversion rates by up to 80%.
11. ¼ of companies cite rapid improvements in technology as their greatest barrier to improving conversion rates.

While increasing their website conversion rates, most organizations struggle to adopt novel technologies, while 20% had problems understanding online behavior at scale and 20% understanding points of improvement.
12. CTAs used as anchor text in blogs improve conversion rates by up to 121 percent more than banner ads.
A decade ago, banner ads proliferated the internet. They were so ubiquitous that most people just tended to tune them out because they got used to seeing so many of them online. This is a phenomenon called “banner blindness” and is one perfect reason why your CTAs are much better integrated into anchor text.
The majority of marketers (about 35%) divide the number of sales by qualified leads as the best way to calculate their lead conversion rate.
Other popular methods include dividing the number of sales into the total number of leads (32%), contacted leads (11%), and opportunities (10%), which sales conversion rate statistics further reveal.

39.3% do follow a process but have yet to structure and document it, and one in five marketers reported not following a CRO process at all.
As a research-oriented and data-driven approach, CRO works best when its stages are structured rather than handled reactively and positioned within the larger marketing efforts efficiently.

Depending on your type of business, you now know where to focus your marketing efforts for the best ROI.

Running up to a couple of tests per month is the most common test velocity among professionals, and about 9% of optimizers run more than 20 tests a month.
Running client-side tests are the most popular at 55%, while 17% run server-side tests and 27% do both, conversion rate optimization stats reveal. A/B tests are the most popular types and are used by almost all optimizers surveyed. A little over one-third also tests more than one variation.
17. Less than 0.11% of the total websites online are using CRO tools or running tests.

According to Builtwith, a tool that tracks the software that websites are using, they can only find 1,110,585 sites using CRO testing tools at this time.


Sources:
https://startupbonsai.com/conversion-rate-optimization-statistics/
https://99firms.com/blog/cro-statistics/#gref
https://marketing.dynamicyield.com/benchmarks/conversion-rate/
https://www.ruleranalytics.com/blog/insight/conversion-rate-by-industry/
https://www.convertcart.com/blog/ecommerce-conversion-rate-by-industry
Information related to conversion rate benchmarks is among the most protected data on the web.
There’s a reason for this secrecy. Not many website owners wish to share their performance metrics with competitors.
That said, there are tools to decipher the number of visitors a website receives and give an idea about its conversion rate.
The question now is: what is a reasonable conversion rate?
The answer: it varies. What’s great for one industry might be subpar for another.
One multi-billion-dollar company I once worked with had conversion rates of 41% for first-time visitors. And they still wanted more.
The key is understanding the average ecommerce conversion rate and benchmarking your performance against it. Once you know whether you’re meeting the average for your industry, you can work to improve conversion rates until you’re in the top 10 percentile of performers.
You need to improve if your website converts at around the average mark.
This article has been updated for 2024 to include new data for the average conversion rate across ecommerce industries, countries, etc.
First, you should understand that the conversion rate is highly contextual.
A store selling high-end electronics isn’t going to have the same conversion rate as one selling $10 t-shirts. Similarly, a store with a loyal email list of 100,000 hungry buyers will see far better conversions than one buying cold traffic off Facebook.
Some of the variables that impact conversion rate include:
Furthermore, “conversion rate” generally signifies the percentage of visitors who turn into customers. You might have different goals you are trying to optimize for (say, the percentage of visitors who add a product to a cart, download a lookbook, fill out a contact form, etc.).
The term “average conversion rate,” thus, can be a bit misleading.
If you’re having a hard time boosting your ecommerce conversion rate, this video is for you:
7 Ways To Boost eCommerce Conversion Rate (Part 1)
Conversion rates are a vital metric for understanding the effectiveness of your online presence.
A “conversion” isn’t just about making a sale—it involves any essential action a visitor takes on your website, turning them from a casual browser into a lead or customer.
Before we get into more details, let’s look at the overall conversion rate benchmarks:
An ecommerce conversion rate refers to the number of people who placed an order online at your store compared to the amount of traffic.
You can discover your ecommerce conversion rate using this formula:
Ecommerce conversion rate = orders/number of visits X 100%
Consider this scenario:
Your store gets 1500 visits and 75 places an order. Using the formula above, this will be;
75/1500 = 5%.
This metric has different names depending on your analytics.
Here’s an example of ecommerce conversion rate in Google Analytics:

The ecommerce conversion rate measures how well your online store is converting.
Success for an ecommerce business isn’t in the monthly traffic it gets but in the number of orders placed from that traffic. This is what defines conversion rate.
If you’re driving a ton of traffic with little to no conversions, it’s not a traffic issue on your site but a conversion problem that requires a deep dive into your site to find possible areas of improvement.
How do you know you need to investigate your site’s conversion rate?
These are just some reasons to consider your site’s conversion rate.
That said, you can’t implement changes suddenly. The first step to boosting your conversion rate is analyzing your website and customer behavior.
How will you analyze your website and customer behavior to improve conversion rates? Here are some ways:
All these actions aim to look for common patterns and complaints. Then, you prioritize them based on which impacts the bottom line more, create a hypothesis for the more significant issue, and then proceed to A/B tests.
This is how you tackle conversion rate issues. You don’t just make changes to your site—you need to hear from your site visitors about their experience and how you can improve.
Let’s see how industry, channels, and additional influential factors categorize the latest commerce conversion rate benchmarks.
Where does our data on conversion rate benchmarks come from?
This article uses data from over 300 websites tracked by Invesp, publicly available statistics from sources like Statista, and various analytics tools.
As ecommerce continues to grow globally, understanding industry-specific conversion rates becomes essential for businesses aiming to optimize their online sales strategies.
Here’s a look at how different sectors perform, reflecting variations in consumer behavior and purchase patterns across industries.

Conversion rate benchmarks in the fourth quarter of 2023 by industry (Source: Statista)
Here’s a quick overview of conversion rate benchmarks across various channels, including social media, paid search, email marketing, and direct traffic. It will give you an idea of what to expect and how different channels serve unique roles in the consumer journey.
Social Media Channels:
Paid Search (Google Ads):

Email Marketing:
Direct Traffic:
Overall, each channel contributes uniquely to the sales funnel. Understanding these contributions will help you allocate resources accordingly and develop strategies that resonate with your target audiences.
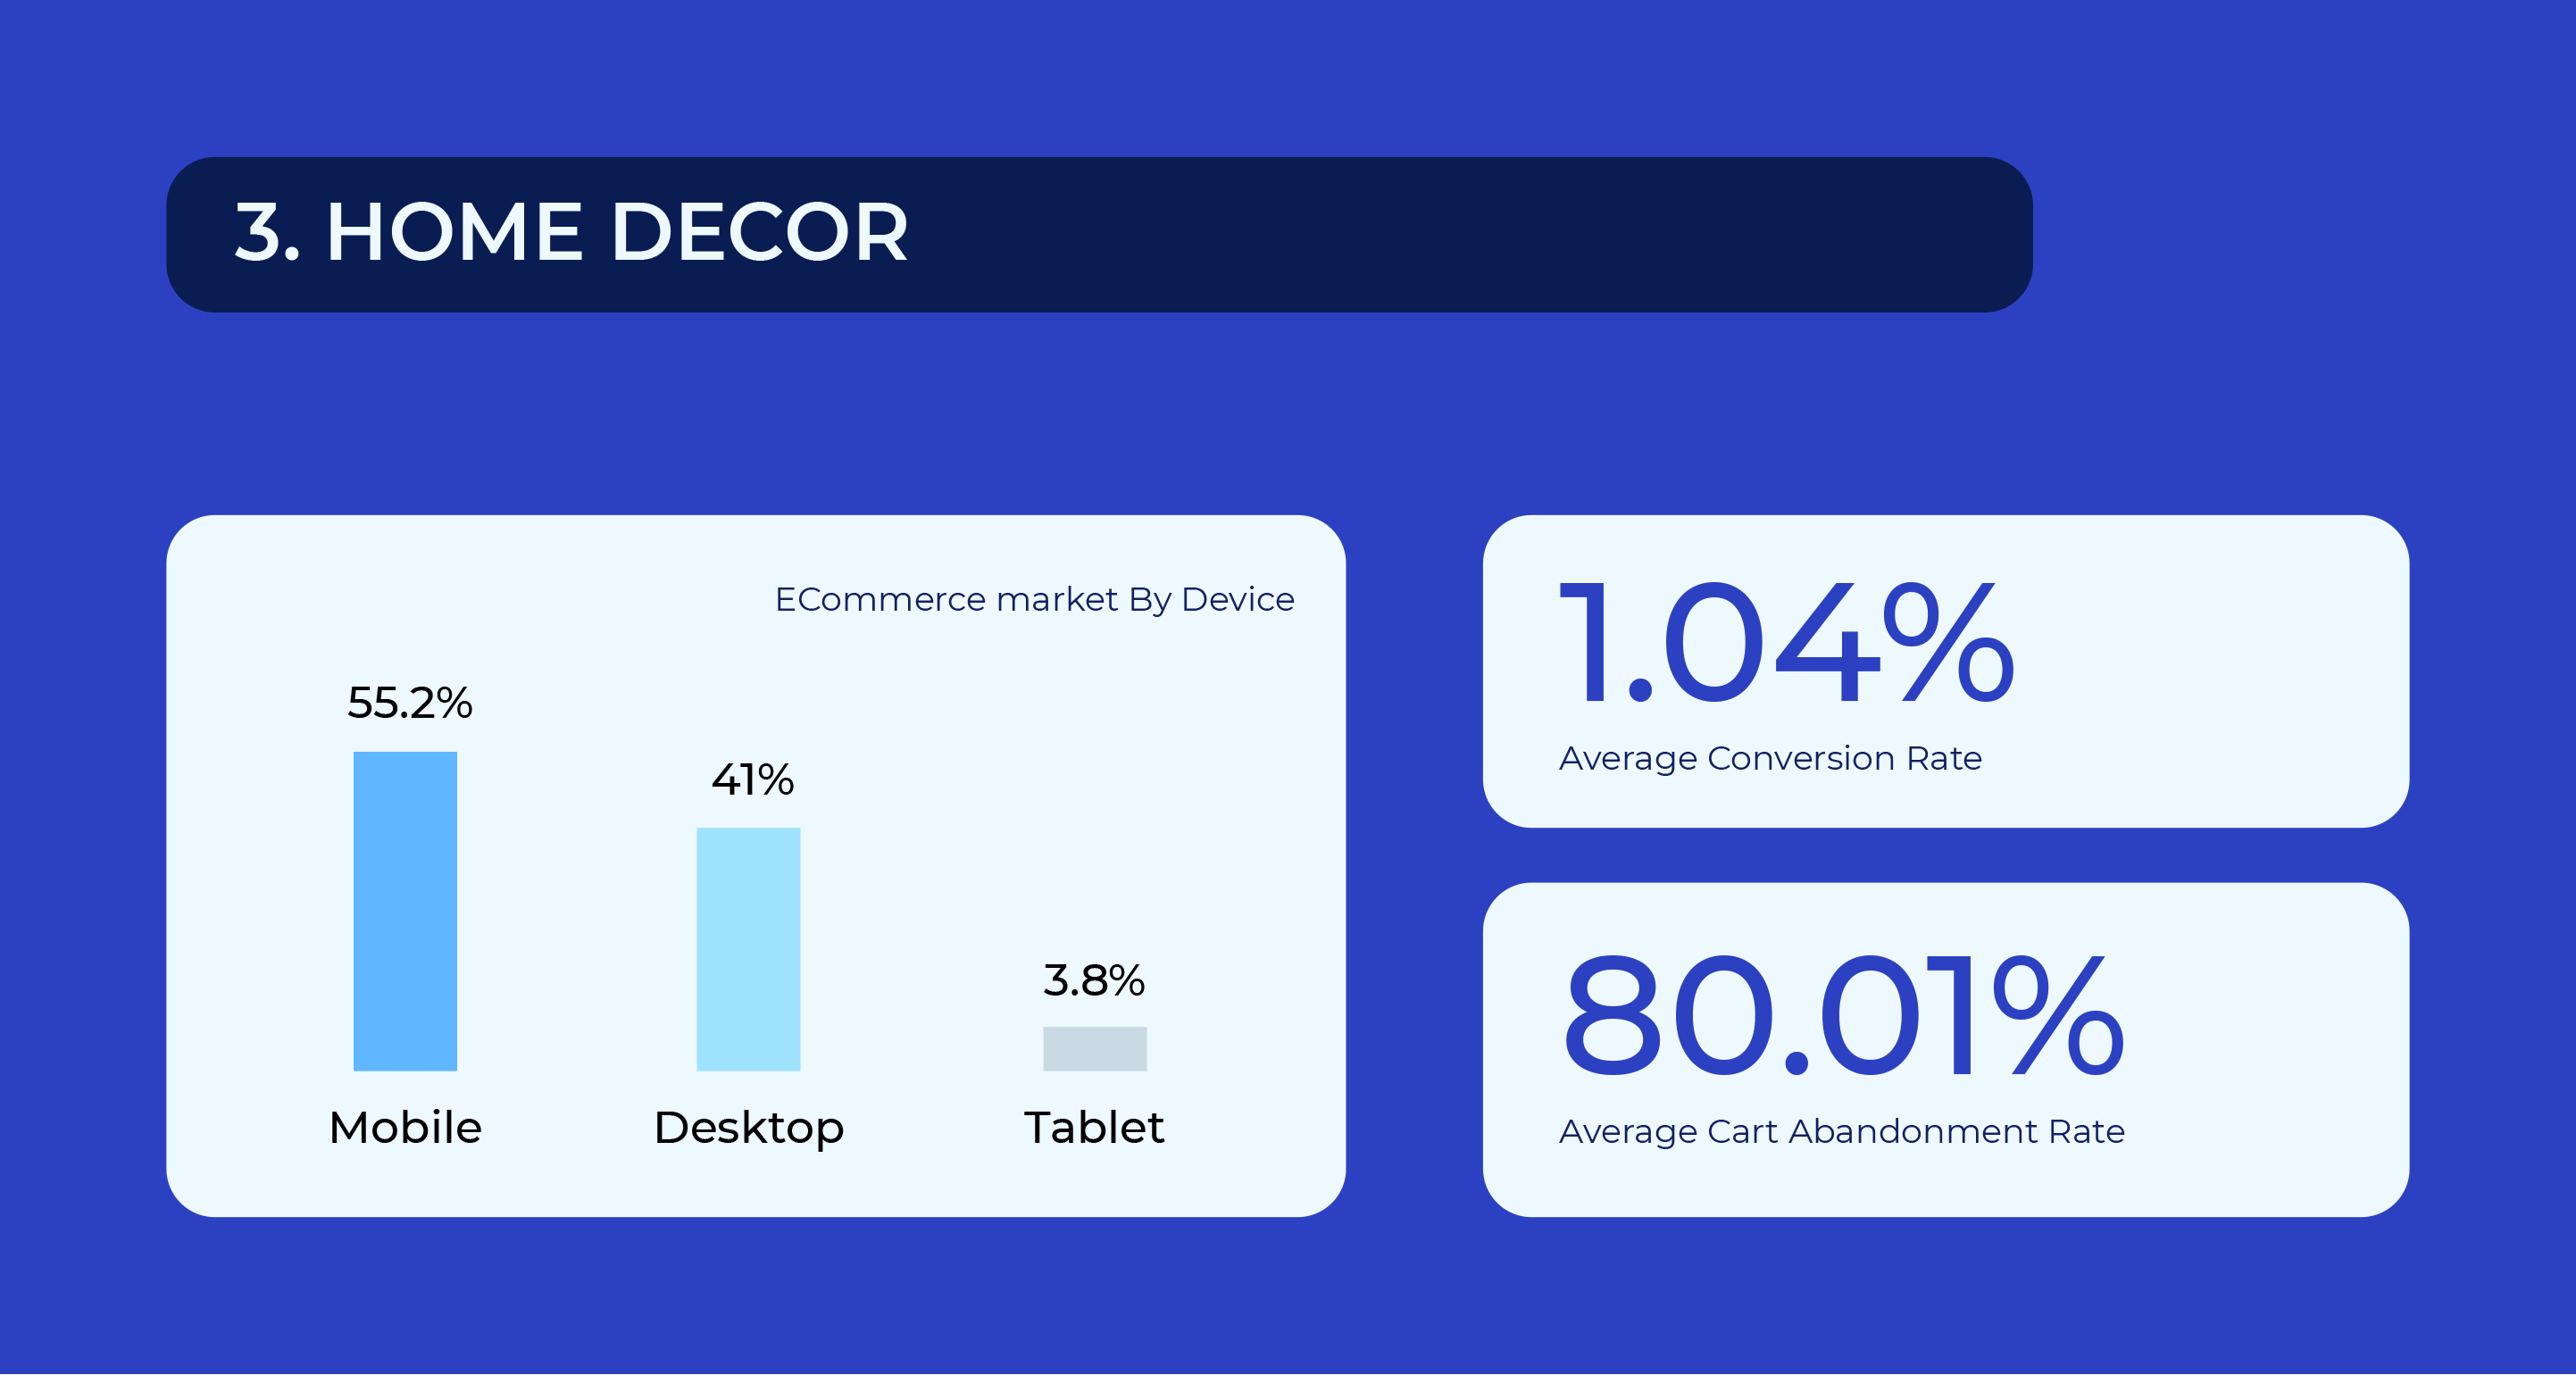
Let’s delve into the ecommerce conversion rates by different devices (Source: Statista).

Ecommerce conversion rates as of December 2023, by device (Source)
Desktop Devices:
Tablet Devices:
Mobile Devices:
Despite growing mobile usage, conversion rates on mobile devices are slightly lower than on desktop, stressing the importance of mobile-optimized shopping experiences.
Also, remember that these averages can vary based on industry, user behavior, and other factors. Regular monitoring and optimization are essential to enhance conversion rates across all devices.
If your ecommerce product is on the tech scene, paying attention to these ecommerce conversion rates by platform is crucial.
If you’re planning to expand your business globally, these average ecommerce conversion rates by region will come in handy:
The following section covers how to improve your website’s conversion rate.
You can take action to improve user experience on your website, which will eventually help you increase your ecommerce conversion rates.
Here’s a list of some of the best ecommerce conversion rate optimization strategies you can implement immediately. The list won’t be exhaustive; it is just a pointer.
Have you tried zooming into images to get clearer details yet couldn’t?
Did you end up making the purchase? Most likely, no.
The same thing happens on your website. When users cannot zoom in to see smaller details and your image resolution is poor, they will not buy.
The solution is to use images with higher resolution, 360-degree function, and zooming ability.
‘This product was good.’
‘I enjoy using this product.’
‘I couldn’t sleep well at night for years until I came across the Aquapedia mattress; now I need to set the alarm to wake up; if not, I’m not sure I’ll ever wake up. This experience is so good, I don’t want it to end.’
Which of these reviews do you prefer?
Which of these reviews will motivate potential customers to buy from you?
If your guess is as good as mine, the third review.
Use more social proof with stellar reviews on your money pages to increase conversions.
Many checkout stages have unnecessary steps that make the shopping experience unpleasant.
How do you compel your audience to make the purchase? Here are four quick steps to improving your checkout page.
The above charts show that social media converts fairly poorly compared to search and email; both underperform against direct traffic.
If improving conversion rates is your priority, focusing on better converting channels will yield better results. Dig into your analytics report to see where most of your traffic comes from. If your top channel is social and you have very little direct traffic, it might be a good idea to divert marketing resources to PPC or invest in an email campaign.
Similarly, email yields better conversion rates than social and search. Consider investing in an email marketing campaign to increase your store’s overall conversions.
Different product pages and product categories will have different conversion rates. Dig through your analytics to see what pages convert best. These should be the top priority in your marketing campaigns.
For example, if your t-shirts convert better than your shoes, promote the former on your site and your marketing.
At the same time, also consider what products contribute the most to your bottom line. A $1,000 product that converts to 2% is better for your store than a $10 product that converts to 10%.
Finding a product with a reasonably high order value and strong conversion rates can do wonders for your store.
When split testing, it is easy to fall into the trap of making small changes (such as changing a button color) and expecting significant returns.
Such an approach will rarely, if ever, yield unicorn-level conversion rates of 5-10% or higher. To get to that level, you have to look beyond cosmetic changes.
Try the following with your tests:
Optimize your site for mobile users even if you don’t invest in a mobile app. According to Criteo, mobile-optimized sites convert more than 100% higher than non-optimized sites.
However, smartphone traffic conversion rates are lower than desktops and tablets.
Improving the mobile shopping experience can significantly boost your bottom line. One way to do this is to invest in a mobile app.
While the upfront costs will be high, a mobile app offers several advantages over a mobile website:
This is one reason some retailers are switching mobile websites altogether and going ‘app only.’
Understanding and applying the right conversion rate benchmarks can be a game-changer for your e-commerce sites.
Whether you’re just starting or looking to refine your strategies, knowing where you stand with these benchmarks allows you to set realistic goals. Once you know where you stand, you can strive to reach the top of your business performance.
Remember, every percentage point increase in your conversion rate can boost your revenue. Therefore, constantly testing and optimizing your site based on these benchmarks isn’t just a good practice—it’s essential for staying competitive and growing your business.
Ready to explore conversion rate optimization more deeply? Visit the Invesp blog for more CRO insights, the latest trends, and actionable strategies to boost conversions and your ecommerce success.
1. How To Calculate Your Website Or Campaign Conversion Rate
2. How to Create a Robust Conversion Optimization Plan?
3. Google Analytics Metrics That Impact Conversion Rate Optimization
4. The Conversion Framework: 7 Principles to Increase Conversion Rates
5. The Science Behind Successful Ecommerce Conversion Rate Optimization
A/B testing is essential for Conversion Rate Optimization (CRO). Popular sites like Google and Amazon use it to optimize their website elements. While many companies use A/B testing, analyzing the results can be complex.
One small mistake can lead to incorrect conclusions and lost conversions.
This article will guide you through analyzing A/B test results and statistically significant results, regardless of the tool you use.
A/B testing, or split testing, involves comparing two versions of a web page or email to determine which version generates more conversions.
Let’s say you’re running a lemonade stand and figuring out how to get people to buy your refreshing drinks. You could try two different signs: one that says “Ice-Cold Lemonade” and another that says “Freshly Squeezed Lemonade.”
This is the essence of A/B testing: you create two versions of something (in this case, your sign) and see which performs better.
In the digital world, this “something” could be anything from a website’s headline to the color of a button. You show one version (version A) to half of your visitors and another version (version B) to the other half. Then, you track which version leads to more clicks, purchases, or whatever goal you’re aiming for.
Let’s examine a real-world example to see how A/B testing works in action and what makes it so powerful.
Our CRO team noticed a dip in conversions on one of our client’s product detail pages (PDPs) and suspected that the price placement might be causing friction for potential customers.
We decided to run an A/B test with different price placements to get to the bottom of this.
In version A (Control, we placed the price at the top of the page above the product image.

When visitors reached the “add to cart” CTA at the bottom of the PDP, they had to go up to see the price. It caused friction and made them abandon the page.
In variation 1 “B,” We placed the price and the reviews above the “add to bag” CTA.
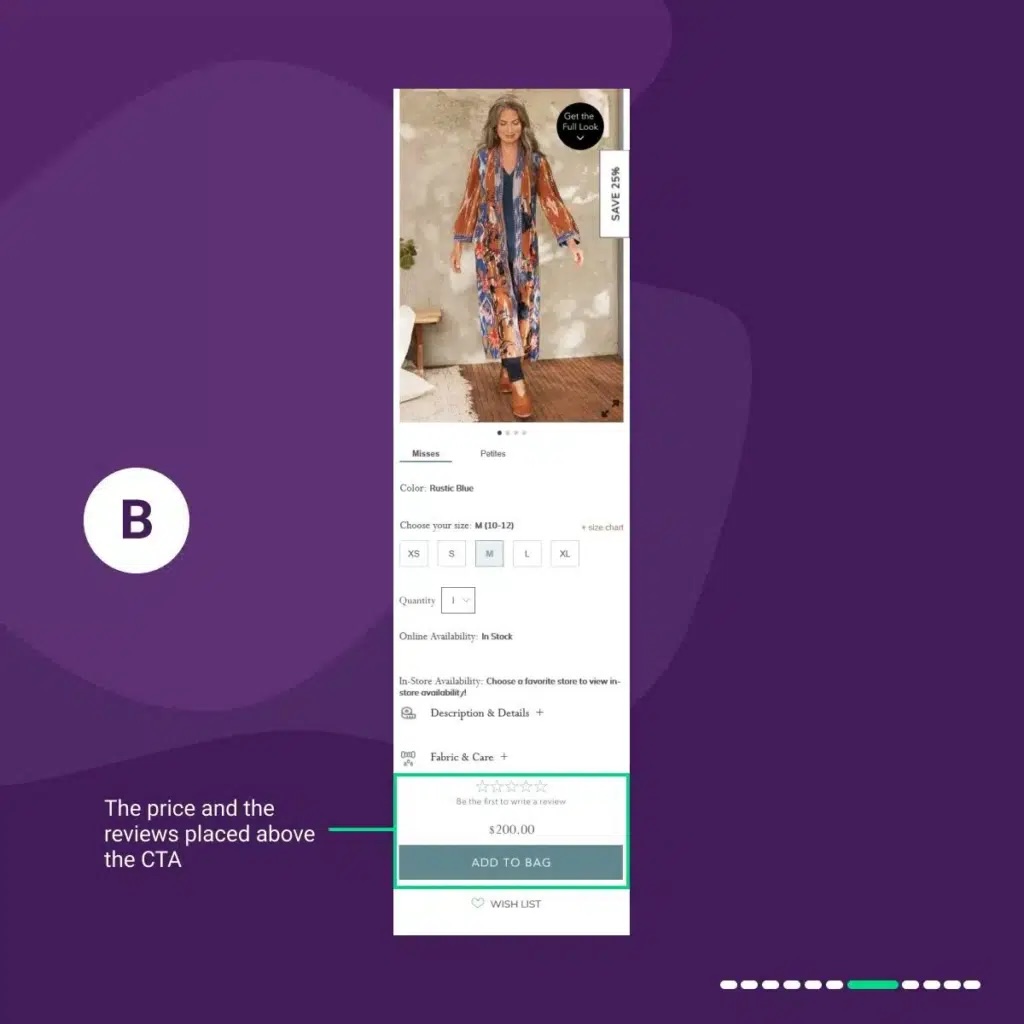
In variation C, we placed the price above the “add to bag” CTA and the reviews below.

In variation “D,” We placed the price below the product image.

In variation 4 “E,” We placed the price next to the quantity field.

The results were quite eye-opening:
What did we learn from this?
By testing and making data-driven decisions, we achieved a 5.07% uplift in conversions, a considerable improvement that can translate into significant revenue growth for our business.
To know more about A/B testing and how to conduct A/B tests, you should read our in-depth guide to A/B testing.
Congratulations, your test won!

So, what’s next? Should you permanently remove the old design and ask your developers to implement the winning variation?
No, not yet!
Before you do that, you must ensure your results are correct. This means you must investigate and know the factors contributing to the win. Remember, A/B testing is not about running tests and hoping for wins. It’s also about learning.
You’ve run your A/B test, and now you get to see what happened. There are a few possible scenarios:
What it means: One of your variations has outperformed the original (control) version. This is typically determined by reaching a pre-set level of statistical significance (more on that later).
For instance, you tested the control against three variations (V1, V2, and V3), and V2 won.
The next thing you should do is re-run the test; this time, you should only test the control vs. the winning variation (V2, in this case).
If the initial results are correct, V2 will win again, and you can draw some learnings that you can propagate across the site.
You should also consider allocating 100% of the traffic to the winning variation. This means pausing the experiment, duplicating it, and resetting the traffic allocation.
What it means: Sometimes, depending on how reasonable your developed hypothesis was, more than one variation can outperform the control, but it needs to be clarified which one is the absolute best.
As good as it might sound, it can be confusing—in the sense that you might not know which variation to go with.

Look closely at the data to see if there are subtle differences between the winning variations. Is one slightly better in terms of conversions or engagement?
Looking at the above screenshot, it’s easy to choose variation four in such cases because it is the highest-winning variation. But is ignoring other winning variations (1 and 3) a good idea?
To gain insights into how your most valuable customers respond to the changes, segment your test results by:
This can reveal how different user groups respond to changes.
For instance, let’s say yours is a lead generation website, and you’re trying to test multiple variations of trust signals.
All V1, V2, and V3 are winners and showed an uplift in conversions.
In such cases, you can combine all the winning ideas into a single design you will implement on the site.
What it means: None of your variations performed better than the original version.
Don’t despair—even “losing” tests provide valuable insights.

An A/B test can fail when the variation(s) running against the control fails to beat the control design in terms of the primary and other goals set in the test. A good example is when the control/original version gets more conversion uplifts than the variation(s).
This can happen even if you follow all the A/B testing best practices and correctly run the test.
When your test loses, you should:
Here is what I mean by this:
Often, the solution you present in an A/B test is the most likely element to need to be corrected.
This is because solutions can be subjective, with multiple variables like location, copy, look, and UX. Most tests focus on evaluating solutions, as the underlying problem and research are usually thorough.
First and foremost, most tests run at Invesp are evaluated from a solutions standpoint. The reason for this is typically the problem uncovered, and the research conducted was thorough. The hypothesis is highly based and driven by data. The solution is the part that can be more prone to human assumptions.
Remember: a single hypothesis can have multiple solutions. Even logically sound solutions during design discussions may not resonate with site visitors. If a test fails, reconsidering discarded solutions can be beneficial.
For instance, let’s say a hypothesis has four possible solutions:
Because they want to learn which web element had the most impact on increasing conversions, optimizers sometimes test only all the possible solutions in a single test. In this case, the first test may aim at solutions 1 and 2. If the test has no positive results, once-discarded solutions 3 and 4 are tested.
In A/B testing, a hypothesis predicts how a change will affect conversion rates.
If your test results don’t turn out as expected, your hypothesis might be incorrect. This could happen if your prediction based on the data were wrong or if the data supported multiple predictions.
For example, if visitors aren’t clicking your CTA button, increasing its size might not help if the issue is the button’s placement or uncompelling copy.
Test failures can also occur if your variations aren’t based on a hypothesis. Testing random ideas with proper research is a good use of resources. Instead, conduct thorough research, formulate a solid hypothesis, and design your test accordingly.
In CRO, we use both qualitative and quantitative data. Validating both types is crucial before launching an A/B test. This involves confirming qualitative findings with quantitative data or vice versa.
For example, if Google Analytics shows a high bounce rate on a page, watching session replays can reveal the cause.
We can approach data revalidation in two ways:
When an A/B test fails, revalidating your research data is essential. If you initially used one approach, try the other for a different perspective. Ideally, utilize both approaches to gain a comprehensive understanding of the problem on your site.
Finally, it’s time to analyze your A/B test data.
When interpreting the results of your A/B test, there is a validity checklist you should tick to avoid false positives or statistical errors. These factors include:
It makes no sense to conclude any A/B test results without verifying their validity.
So, here’s a detailed insight into each factor you should consider when analyzing A/B testing results.
Whether you are running the A/B test on a low or high-traffic site, your sample size should be big enough to ensure that the experiment reaches a significant level. The bigger the sample size, the lesser the margin of error.
To calculate the sample size for your test, you will need to specify the significance level, statistical power, and the relevant difference between the rates you would like to discover. If the formula is too complicated, there are easy-to-use online sample size calculators.

If you do not calculate your test’s sample size, you risk stopping it too early before it collects enough data. Khalid wrote an article about this and had this to say about sample size:
“Any experiment that involves later statistical inference requires a sample size calculation done BEFORE such an experiment starts. A/B testing is no exception.”
Also, consider the following when evaluating the sample size:
The statistical significance level (or confidence, significance of the results, or chance of beating the original) shows how significant your result is statistically.
As a digital marketer, you’d want to be sure about the results so that the statistical significance indicates that the differences observed between a variation and control aren’t due to chance.
The industry standard of statistical significance should be 95% (or 90% in some cases). This is the target number you should consider when running an A/B test.
95% statistical significance means you are 95% confident that the results are accurate. It means that if you repeat the test repeatedly, the results will match the initial test in 95% of cases.
When can you end an A/B test? It depends on several factors but shouldn’t end prematurely or drag on too long.
Our CRO manager, Hatice Kaya, suggests running a test for at least an entire business cycle or seven days.
This can vary depending on the product or service, as some sell more on paydays and less throughout the month.
Every website has a business cycle—the time it typically takes customers to purchase. Some sites have lower conversions on weekends and peaks on weekdays. Run your test throughout the cycle to account for fluctuations and get valid data.
Seven days is a minimum. The actual duration depends on your site traffic. Lower traffic requires more extended tests.
Use an online A/B testing calculator to determine the optimal duration. For example, with 5000 daily visitors and three variations, a test should run for 18 days.
It’s a common belief that website conversions depend on traffic volume. High-traffic sites usually get more conversions, and vice versa.
However, when you run a test on high-traffic sites, you do not have to worry about the number of conversions; you should just focus on reaching the required sample size for that traffic.
But when it comes to low-traffic sites, to get more accurate results, you should keep in mind two factors:
Your test should reach the required sample size and have at least 2-300 conversions per variation (this is the pure minimum). It is even better if it reaches more than 300 conversions per variation.
So, now we have checked our test results and made sure that they are valid and don’t contain any statistical errors. Let’s move on to a deeper analysis.
Several external and internal factors impact every website you see. These factors include:
These factors increase data variance, leading to less accurate results. If your test runs during a holiday, consider relaunching it later to verify the results.
While analyzing macro conversions (sales, leads, subscriptions) is essential, examining micro-conversions provides more profound insights.
Micro-conversions vary by business and website type, but examples for e-commerce sites include:
Here is an example of micro-conversion goals you may need to analyze for an ecommerce site.

Although micro-conversions don’t directly increase your conversion rate, they help move prospects down the funnel, leading to more purchases. Understanding micro-conversions can also explain why a test is performed a certain way.
Not all A/B tests will be winners, and conversion specialists must accept this reality. However, losing tests can be valuable learning opportunities.
Anwar Aly, a conversion specialist at Invesp, advises,
“If the loss rate is normal, businesses should learn from lost tests, recognizing that loss is part of A/B testing and can sometimes be more valuable than wins. If the loss rate is high or constant, re-evaluate your testing approach, possibly starting with a new audit and utilizing qualitative data to validate test hypotheses.”
In this section, I walk you through a checklist to evaluate losing tests and what you can do differently.
A poorly thought-out hypothesis will result in poor AB tests and results. A characteristic of a poor hypothesis is the lack of insights driving the hypothesis.
This means that the company testing or the CRO agency often guesses what to test; it’s not a product of conversion research.
To create a better insight-driven hypothesis, you should use this format:
We noticed in [type of conversion research] that [problem name] on [page or element]. Improving this by [improvement detail] will likely result in [positive impact on key metrics].
So you can see what I mean; a real example of this would be:
We noticed in [the session recording videos] that [there was a high drop off] on [the product page]. Improving this by [increasing the prominence of the free shipping and returns] will likely result in [a decrease in exits and an increase in sales].
You’ll be surprised at how similar many variations are to the control.
What happened? Maybe a sentence was changed, or the color of the call to action button, but nothing major.
In this instance, getting a winning test is almost impossible because the variations don’t look different.
Check out this video to see the different categories of A/B tests we do to give you a different perspective:
It’s normal to go through heatmaps and session recordings to see how site visitors and users engage with a page pre-test.
Post-test? Not so common.
This is a viable missing link in understanding why a test failed.
When you conduct post-test heatmap analysis and session recording of pages tested, you can see whether users engaged with or noticed the element you were testing.
Visitors click maps show heat maps of what visitors click on and how far they scroll down your pages. Even more important are visitor session recordings, which allow you to watch visitors’ exact mouse movements and journey through your website.
Many businesses focus on variation design in A/B testing, but the execution is equally important. Launching an experiment isn’t the end of the process; mistakes can invalidate your results.
Running an A/B test is not always about finding a variation that generates more conversions; sometimes, it’s about learning the changes in user behavior.
You should constantly be testing to understand your visitors, their behaviors, and the web elements that influence their behavior change.
Regarding conversion rate optimization or CRO, even Google Trends tells an illuminating story.
Over the past five years, the search term “Conversion Rate Optimization” has experienced a significant uptick in interest, indicating a growing recognition of its importance among businesses across various sectors.

Not including CRO in your budget isn’t just a mistake; it’s a big one. There’s a good reason why all the top companies are doing some form of CRO or experimentation.
In this article, we’ll talk about the world’s best conversion rate optimization companies. To make it easy for you to choose one, I’ve divided the agencies into three categories:
Dedicated CRO Agencies: These experts focus solely on making your website perform better and bringing in more paying customers.
Smaller Agencies: They might be smaller, but they offer customized solutions and give you more attention.
Full-Service Agencies: If you want an all-in-one package for your digital plan, these agencies provide a wide range of services, including CRO.
As we go through these categories, you’ll see why CRO is essential and how it can help your business grow.

Since 2006, InvespCRO has optimized conversions for primary, medium, and small brands, including 3M, CampusBooks, Impact, Home Gallery Sores, eBay, O’Reilly, etc.
With a presence in Chicago and Istanbul, Invesp is the world’s number-one conversion optimization agency. Since our inception in 2006, we’ve led the charge in North America as the second CRO company to specialize exclusively in conversion optimization.
Our track record speaks for itself: Over the past 17 years, we’ve empowered 900+ companies across various industries, including retail, e-commerce, and automotive, to not only boost their conversion rates but also increase their revenue.
We’re not just about numbers; we’re about results. To date, we’ve conducted a staggering 32,000+ A/B tests, delivering game-changing insights to our clients.
Our founders, Khalid Saleh and Ayat Shukairy, aren’t just CRO experts in the field – they’re published authors. Their book, ‘Conversion Optimization: The Art and Science of Converting Prospects to Customers,’ is a must-read for anyone venturing into the world of conversion rate optimization.
In 2023, Clutch named us the world’s top conversion optimization agency. We’ve been recognized as the leading CRO company in Chicago, maintaining our position as a global leader since 2021.

Since 2007, we’ve developed the conversion framework (an in-house framework) that removes the guesswork from the conversion optimization process. It provides anyone interested in optimization with a specific methodology to produce consistent results.
1. Conversion rate optimization
2. User and conversion research.
3. Conversion rate audit and CRO strategy
4. Landing page optimization
5. UX design
6. CRO training.
7. Analytics powered by e-cens.


Helping globally recognized companies like Amazon, Apple, Google, and Facebook maximize conversions since 2006.
Conversion Rate Experts has worked with businesses in over 40 countries and 11 languages. This gives them a broad perspective many CRO agencies don’t have.
Their CRE methodology (broken into nine steps) has helped them generate 100’s of millions in revenue for clients.
They also have a proprietary wins database (based on 17 years of launching experiments) that helps them know what works in each situation. For each win, they record the objections faced, the techniques used, and the outcomes—all tagged by variables such as type of website, market vertical, business size, geography, conversion goal, and resulting improvement.
1. Conversion rate optimization (CRO), landing page optimization, and customer-journey mapping—with A/B testing and multivariate testing
2. Email marketing
3. Analytics, including tracking, traffic analysis, and conjoint analysis
4. Marketing research
5. User experience (UX), including usability testing
6. Website design and information architecture


With offices in the US, CRO Metrics has driven data-backed conversion wins for clients like Allbirds, Bombas, Calendly, Clorox, and Doordash since starting in 2010.
Since their inception in 2010, they’ve launched over 30,000+ experiments on hundreds of websites.
They also own an internal SaaS, which they use to launch experiments for their clients (Iris by CRO Metrics).
At CRO Metrics, their clientele is made up of ecommerce (30%), business services (25%), and consumer products and services (15%).
1. Analytics
2. Conversion Rate Optimization
3. Paid Media
4. Lifecycle Marketing
5. Experiment-Led Redesigns


Conversion is a global CRO agency formed in 2022 by integrating two separate agencies: Conversion.com in the UK and Widerfunnel in North America. Both original agencies were formed in 2007 by Stephen Pavlovich (Conversion.com) and Chris Goward (Widerfunnel).
Conversion has worked with leading brands like Microsoft, Canon, SAMSUNG, Toyota, etc. to optimize conversions.
With 100+ CRO specialists across the UK and North America, Conversion uses a unique blend of A/B testing, UX research, and personalization to improve our clients’ websites and businesses.
By experimenting with new messaging, design, functionality, and even pricing and products, they’ve helped their clients generate over $2 billion in additional revenue.
Their approach combines several frameworks to help clients make more decisions with confidence. Examples of frameworks they deploy for clients include the PIE framework, Levers framework, Easier scoring model, etc.
1. Conversion Rate Optimization
2. Enterprise program consulting
3. Product and pricing experimentation
4. Effective personalization.
5. Conversion centered design.
6. User experience research.
7. Liftmap

Founded in 2011 as CXL, Speero has always prioritized optimizing customer experiences.
Trusted by clients like – Miro, GrubHub, Dermalogica, MONSTER, etc.
In 2020, the company changed its name from ‘CXL’ to Speero to support its renewed focus on helping companies understand their customers better through data, research, and experimentation to drive long-term growth, not just short-term wins.
With offices across the UK, Europe, the US, and Asia Pacific, Speero works with medium to large enterprises globally.
Speero is popular on LinkedIn for its blueprints/frameworks, which they share. Examples include – models, blueprints, methods blueprints, etc.
1. Experimentation/CRO
2. Research&Strategy
3. Data and analytics.

Since 2013, theGood has combined indepth user research, analytics, and robust user testing to boost conversions for global brands like New Balance, Xerox, Easton, Swiss Gear, etc.
They have a mix of unique frameworks and methodologies like comprehensive ecommerce conversion audits and tailored conversion growth programs for clients.
1. Conversion growth program
2. Comprehensive conversion audit.
3. Data-driven redesign.
4. Conversion research and consulting.
5. Small business optimization

The metric we used to qualify these agencies as smaller is based on the number of their employees, which can be verified on LinkedIn.

Founded in 2014, Conversion Advocates has helped 100’s businesses in widely varying industries increase conversion rates, gain insights into their customers, and grow their revenue month-over-month using powerful data-driven experiments.
They use their IIEA framework to increase conversions, reduce costs, and help clients better understand their customers.
Ranked #3 Out of 2,562 CRO Agencies Worldwide in 2019.
Trusted by brands like Zillow, SurveyMonkey, MVMT, etc.
ConversionAdvocates promises a 90-day growth methodology that’s guaranteed to deliver results.
Here’s the average result from over 200 + companies who participated in their 90-day program – 8.7X Return On Investment, 26.6% increase in conversion rates, 37.7% validated win rate, 13.8 experiments launched, and nine research methods used.
1. Research and Analysis.
2. Cross-channel optimization.


Since 2014, Conversion Fanatics has driven improved conversions for companies like HarperCollins publishers, Ministry of Supply, Dr Axe, etc.
Kaizen principles drive them and believe in relentless continuous improvement (a good motto if your focus is delivering conversion rate optimization services).
They have helped optimize 250+ companies and have launched 15,000+ split tests.
1. CRO/experimentation
2. Brand design.
3. Traffic management.
4. Reporting and Analysis.


Established in 2010 by Rishi Rawat, Frictionless Commerce specializes in improving the conversion rates of product pages only.
They don’t bother about any other page on your website, just the product page, and to make your product page into the strongest sales pitch it can be.
At frictionless commerce, they work with eCommerce businesses whose best-sellers are doing $400,000 in sales or $1.8 million in annual sales.
1. Product page optimization


Hype Digital is a global CRO agency that has been helping companies increase their website and app conversion rates since 2017.
Founded in Cape Town, South Africa, Hype was the brainchild of Cameron Calder, former performance marketer for the CR7 brand, and was initially a Paid Advertising agency.
After feeling frustrated that the customers being sent to his clients’ websites were not converting as a result of poorly optimized sites, he and his team created a CRO model that relies purely on data to make decisions. Our heavily research-based model believes in removing all guesswork when making decisions.
Today, Hype has a presence in Cape Town, Tel Aviv, and Amsterdam and works with customers of all sectors worldwide. This allows us to understand what works and doesn’t work for each industry in each region.
Clutch currently lists Hype Digital as the top CRO agency in South Africa and is a proud partner with many website optimization, personalization, and testing tools.
Starts at $3500 (contact the Sales team for more information on different options)


Launched in 2014, SplitBase focuses strictly on high-growth eCommerce businesses and has helped several of them with impressive conversion rates, as seen on their site.
Cerebral, Pela, Dr. Squatch, and Vanity Planet are examples of businesses they work with.
1. Landing page design/optimization
2. Conversion-focused website design
3. Full-site optimization program


Known as the performance marketing agency that doubles revenue, KlientBoost was Founded in 2015.
As a full-service agency, their digital marketing services cut across conversion rate optimization, email marketing strategy, PPC, etc.
They boast 617 case studies plus 250+ active clients.
Some of the businesses they’ve helped include – AirBnb, UpWork, Stanford University, Hotjar, etc.
1. Paid Advertising
2. Conversion Rate Optimization
3. Search Engine Optimization
4. Email Marketing


In Digital Marketing, Neil Patel Digital is a household name. This agency was started by Neil Patel in 2015 and offers SEO, content marketing, paid ads, and CRO.
As the CEO, Neil Patel also offers consulting and has helped 5000 companies, including CNN, Intuit, Adobe, etc.
1. Earned media (SEO, PR, Email marketing, etc)
2. Paid media (paid search, paid social, streaming, etc.)
3. Data & Analytics (Conversion rate optimization, front-end development, user experience)


Since 2010, Inflow has provided web design, SEO, paid ads, CRO, email marketing, and GTM Audits for businesses.
They’ve helped ecommerce businesses like Atranil, KEH Camera, and Vitrazza improve their conversion rates and ROAS.
Their specialty includes but isn’t limited to – fashion & apparel, B2B ecommerce, health & wellness, Pet, etc.
1. SEO.
2. Paid ads
3. CRO.
4. Email marketing.
5. GTM Audits
Contact the sales team.


Linear Design provides paid ads and CRO services to its clients.
Trusted by brands like FlexPod, Order Mark, and Nextbite, Linear Design is focused on profitability, cost per acquisition, and delivering expected business outcomes for clients.
1. SEO.
2. Paid ads
3. CRO.
4. Email marketing.
5. GTM Audits


Founded in April 2021, Prismfly focuses on e-commerce businesses and promises 100% “Done-For-You” conversion rate optimization.
They’ve conducted 1000+ A/B tests with $275 million generated for clients, which include Revival, Miku, Xtrema, Luxy Hair, etc.
Prismfly averages a 20% conversion increase in six months.
1. Shopify Plus Web Development
2. Conversion Rate Optimization
3. Lifecycle Marketing
4. UX / UI Design


Established in 2016, Journey Further provides paid search, influencer marketing, technical SEO, UX, and CRO services to many clients.
Trusted by brands like Oddbox, Sky, Trainline, Casio, etc.
They’ve seen results like a 103% increase in revenue from paid search and a 597% increase in organic revenue from targeted landing pages.
1. Content
2. Paid social media marketing
3. CRO.
4. Digital PR
5. Design


Eric purchased Single Grain for $2.00 in 2014 when it was an SEO agency gasping for its last breath.
Today, SingleGrain works with powerhouses in virtually every sector to drive leads, boost sales and engagements, and help businesses genuinely connect with their clients.
Using state-of-the-art technology fueled by the unmatched passion of people who love what they do, they’re a digital marketing agency to reckon with.
They’ve helped companies like Uber, Amazon, and Siteminder to grow.
1. Content marketing strategies.
2. SaaS.
3. CRO.
4. Paid advertising.
5. Education.

Optimizing your website for conversions is a non-negotiable in today’s business world.
By partnering with top conversion optimization agencies, you can maximize your online success and drive growth for your business. Depending on your business needs, you can choose from the many companies we discussed in this article.
Don’t hesitate to invest in this crucial aspect of your online strategy to stay competitive and thrive in the digital world.
A/B testing vs. multivariate testing? This question plagues every CRO professional every once in a while.
When optimizing your digital assets, knowing whether to use A/B or multivariate testing is critical.
Are you looking to quickly determine the superior version of a webpage for low-traffic sites?A/B testing is your go-to.
Or do you aim to dissect complex interactions between various elements on a high-traffic page? Then, A/B and multivariate testing will provide your in-depth analysis.
This guide breaks down each method and offers strategic insights into deploying them for maximum conversion optimization.
TL; DR? Here are some quick takeaways:
A/B Testing: also known as split testing, compares two versions of a digital element to determine which performs better with the target audience.

It effectively optimizes various marketing efforts, including emails, newsletters, ads, and website elements. A/B testing is particularly useful when you need quick feedback on two distinct designs or for websites with lower traffic.
Key aspects of A/B testing:
Multivariate testing takes it up a notch by evaluating multiple page elements simultaneously to uncover the most effective combination that maximizes conversion rates.

By using multivariate testing, you can gain valuable insights into how different elements or variables impact user experience and optimize your website or product accordingly.
Key aspects of multivariate testing:
Unlike A/B testing, which compares two variations, MVT changes more than one variable to test all resulting combinations simultaneously. It provides a comprehensive view of visitor behavior and preference patterns, making it ideal for testing different combinations of elements or variables.
Deciding between multivariate and A/B testing depends on the complexity of the tested elements and the ease of implementation.
A/B testing is more straightforward and suitable for quick comparisons, while multivariate testing offers more comprehensive insights but requires more traffic and careful consideration of potential biases.
Choosing between A/B and multivariate testing depends on traffic, complexity, and goals.
A/B testing is ideal for limited traffic due to its simplicity and clear outcomes. Multivariate testing offers detailed insights but requires more effort and time.
However, before you set up either of the testing types, you’ll have to form a hypothesis. In the case of multivariate testing, you’ll also need to identify a number of variables you intend to test.
Prior to commencing your A/B or multivariate testing, it’s imperative to construct a hypothesis. This conjecture about the potential influence of alterations on user behavior is crucial for executing substantive tests.
An articulate hypothesis will include:
A compelling hypothesis also embraces the SMART criteria: Specificity, Measurability, Actionability, Relevance, and Testability.
It integrates quantitative data and qualitative insights to guarantee that the supposition is grounded in reality, predicated upon hard facts, and pertinent to the variables being examined.
A/B testing vs. Multivariate testing hypothesis example:
For example, if you’re running an A/B test, your hypothesis could be:
Changing the CTA button of the existing landing page from blue to orange will increase the click-through rate by 10% within one month, based on previous test results and user feedback favoring brighter colors.
If you’re running a multivariate test, your hypothesis could be:
Testing different combinations of headline, hero image, and CTA button style on the homepage will result in a winning combination that increases the conversion rate by 15% within two weeks, supported by prior test results and user preferences.
Selecting the correct multiple variables to assess in a multivariate experiment is crucial. Each variable should have solid backing based on business objectives and expected influence on outcomes. When testing involving multiple variables, it’s essential to rigorously evaluate their possible effect and likelihood of affecting targeted results.
Variation ideas for inclusion in multivariate testing ought to stem from an analysis grounded in data, which bolsters their potential ability to positively affect conversion rates. Adopting this strategy ensures that the selected variables are significant and poised to yield insightful findings.
To implement an A/B testing protocol, one must:
For a more detailed overview of how to run and set up A/B tests, check out our ultimate guide to A/B testing.
To set up multivariate tests:
After this, all the steps remain the same as in the A/B test implementation, including randomly assigning audience to different combinations, determining sample size, and then finally running the test.
Pro Tip: Implement trigger settings to specify when variations appear to users, and use fractional factorial testing to manage traffic distribution among variations. During the multivariate test, systematically evaluate the impact of variations and consider eliminating low-performing ones after reaching the minimum sample size.
Finally, it’s time to analyze your results.
For a thorough assessment of user interactions post-A/B and multivariate testing sessions:
They serve as indispensable tools by allowing you to observe real-time engagement metrics and dissect and comprehend findings after reaching statistical significance in an A/B test.
Interpreting multivariate test data calls for a distinct methodology. In multivariate testing, it is essential to evaluate the collective impact of various landing page elements on user behavior and conversion rates rather than examining aspects in isolation.
This testing method provides comprehensive insights into how different elements interact, allowing teams to discover effects between variables that could lead to further optimization.
When assessing multivariate test data, it’s necessary to:
This process helps optimize your website’s performance and improve your conversion rate through conversion rate optimization.
Both testing methods offer valuable insights, but they also share some pitfalls to avoid.
Here are some common mistakes to avoid when setting up your A/B or multivariate tests:
A/B and multivariate testing are potent methods that can transform how you approach digital marketing. By comparing different variations, whether it’s two in A/B testing or multiple in multivariate testing, you can gain valuable insights into what resonates with your audience.
The key is to embrace a culture of experimentation, value data over opinions, and constantly learn from your tests. This approach can optimize your strategy, boost your results, and ultimately drive your business forward.
Multivariate testing distinguishes itself from A/B testing by evaluating various elements at the same time in order to determine which combination yields the most favorable results, as opposed to A/B testing which only contrasts two variations.
Recognizing this distinction will assist you in determining the appropriate method for your particular experimentation requirements.
When swift outcomes are needed from evaluating two distinct designs, or when your website experiences low traffic volumes, A/B testing is the method to employ.
On the other hand, if your intention is to examine several variations at once, multivariate testing could be a better fit for such purposes.
When setting up an A/B test, it’s crucial to consider the sample size for reliable results and precision, control the testing environment, and use tools for qualitative insights like session recordings. These factors will ensure the accuracy and effectiveness of your test.
To thoroughly assess data from multivariate tests, consider how different combinations of page elements together influence user behavior and ultimately conversion rates. Determine which specific sets of page elements result in the most significant increase in conversions, while also noting which individual components contribute the least to overall site conversions.
Ensure that you allow sufficient traffic to accumulate in order to reach statistical significance. It’s important to factor in external variables such as seasonal variations or shifts in the marketplace, and also be mindful of technical elements like how testing instruments might affect website performance. Overlooking these considerations may result in deceptive test outcomes and false interpretations, which could squander both time and investment.
A Google search for “How to improve website conversion” returns 370 million results, most of which are generic advice.
While best practices and trends can be helpful, they only sometimes address individual website needs. A/B testing, a subset of conversion rate optimization (CRO), offers a solution by testing design changes directly with users.
This article explores the best A/B testing tools and top features to consider when looking for an A/B testing tool for your business.
As a subset of conversion rate optimization, A/B testing is no longer a new field.
It’s been around for a while, and you can access hundreds of tools to run A/B tests.
To properly define an A/B testing tool, I need to mention what an A/B test is.
An A/B test is when you combine two web pages with a difference in one element to see which performs better.
The A/B testing tool allows you to create different web page variations to see which performs better.
These tools automate splitting traffic, tracking user behavior, and analyzing results to identify statistically significant differences between variations.
Key functionalities of A/B testing tools include:
To get a more in-depth understanding of A/B testing, read our ultimate guide to A/B testing.
If you don’t want to skim to read the essential features of an A/B testing tool, you can also watch this quick video:
No matter how unique your A/B testing tool is, it won’t be worth it unless it’s easy-to-use, has an intuitive interface, and requires minimal technical expertise to set up and run tests.
At the same time, look for a visual editor that allows you to make changes without coding.
Your A/B testing tool’s visual editor should allow you to:
That said, the A/b testing tool should also come with a code-based editor that allows your developer to create a variation using JavaScript and HTML/CSS that will be responsive across devices.
A visual editor allows non-technical users to create variations easily, while a code editor enables developers to manipulate site code for responsive variations across devices. Complex tests made with a visual editor can lead to responsiveness issues.
The tool should support a variety of experiment types beyond simple A/B tests, such as:
Your tool should segment your audience and target specific groups based on multiple factors, including their behavior. This will help you tailor your content to particular groups.
Pro tip: Look for a tool that allows you to target based on demographics, behavior, or other custom criteria.
Everyone has a bias. The same can be said of CRO specialists and their statistical approach.
CRO specialists approach statistics in two fundamental ways: the Bayesian and Frequentist models. That said, every tool can record and compute its statistics. For some, it’s Bayesian; for others, it’s Frequentist.
When selecting an A/B test tool, consider your favorite statistical approach. If you’re a Frequentist, you don’t want to pay thousands of dollars for a tool whose analysis is Bayesian.
No A/B testing tool is perfect and foolproof—you’ll need assistance sooner or later, but it’ll happen.
So, no matter how exceptional the tool is, you should have direct access to support staff when encountering an issue. Their site should also have a knowledge base and documentation, making it easy to resolve significant matters yourself.

To stay competitive, businesses must constantly adapt to evolving customer needs. However, releasing untested features can negatively impact interaction and revenue.
A/B testing with feature flagging can help avoid this issue by allowing controlled feature rollouts and testing to ensure customer satisfaction. If your business regularly releases new features, consider an A/B testing tool with feature flagging capabilities.
The tool should provide comprehensive reports and visualizations that clearly illustrate the impact of your tests.
Look for features like heatmaps, click maps, and funnel analysis to better understand how users interact with your variations.
Many businesses today use multiple tools in their tech stack. Before picking your A/B testing tool, ensure it integrates with a range of relevant business tools you already use or intend to use.
Now that we know which features to consider when choosing an A/B testing tool let’s examine the tools that offer all these features and more.

Best For: Businesses looking for an all-in-one conversion optimization platform.
FigPii is an all-in-one tool for conversion optimization and behavior analysis that enables A/B testing, session recordings, heat maps, and even on-site polls and surveys.
Plus, it has a visual editor that lets you make changes to your website without knowing any code.
FigPii also stands out due to its flicker-free A/B testing. This means that when visitors come to your site, they won’t see any annoying flickering or delays as the different variations load. This is a big deal because it can improve the user experience and make your tests more accurate.
Key Features:
Pros:
Cons:
Pricing: The free plan initially allows you to run unlimited A/B tests with up to 15,000 monthly visitors. Paid plans start at 149.99 monthly for up to 30k visitors and unlimited A/B tests.

Best For: Mid to large-sized businesses looking for an advanced A/B testing tool.
Trusted by leading businesses such as Klaviyo, Disney, and L’Oreal, AB Tasty offers an omni-channel experimentation platform for desktop, mobile, and IoT devices.
The platform enables client and server-side testing, personalization (including AI-based segmentation and audience building), and audience activation, leveraging AI and machine learning capabilities.
Like FigPii, it also comes with behavior analysis tools such as heat maps, surveys, and session reports.
Key Features:
Pros:
Cons:
Pricing: Quote-based.

Best For: Large enterprises with complex, multi-channel testing and personalization needs.
Adobe Target, part of the Adobe Experience Cloud, is your one-stop shop for running A/B tests and creating personalized customer experiences.
It offers a comprehensive suite of tools, including A/B and multivariate testing (MVT), multi-armed bandit testing, server-side optimization, mobile optimization, on-device decisions, and connected device optimization.
Key Features:
Pros:
Cons:
Pricing: Quote-based.

Best For: Enterprise-level businesses looking for an all-in-one CRO tool.
Trusted by brands like Hyundai, Wikijob, and Microfocus, VWO is an AB testing and conversion rate optimization tool for enterprise brands.
It also has a visual editor that helps you create and edit variations without any coding knowledge.
Beyond simple A/B tests, you can also use it to implement other optimization strategies like personalization and user behavior analysis. For example, you can access tools like heat maps, session recordings, built-in forms, form analytics, etc.
Key Features:
Pros:
Cons:
Pricing: It starts at $154 monthly for up to 10,000 users. There’s also a freemium plan.
Ultimately, the best A/B testing tool for you will depend on your specific needs, budget, and level of expertise.
For example, if you’re looking for an easy-to-use CRO and A/B testing tool with a visual builder, you might prefer FigPii. Adobe is a preferred option for enterprise companies.
Have you ever wondered why some A/B tests skyrocket conversions while others fall flat? The secret isn’t just having the right tools—it’s following proven best practices.
Done incorrectly, AB testing can waste money, misuse staff hours, and, even worse, decrease conversion rates.
But when done right, A/B testing lets you easily experiment with different web page designs, split traffic to see how each performs, and gain valuable insights into what truly resonates with your audience.
Here are 11 best practices you must follow to ensure your A/B tests deliver tangible results.
Wrong expectations lead to disappointment and lost investment. Many marketers conduct A/B tests because they read or watched a case study where a company increased conversion rates.
While success stories are inspiring, they shouldn’t be your sole benchmark. Every website is different, and your results will depend on various factors.
Here are two approaches you can take to set the right expectations:
Since 2006, our team has worked with hundreds of global organizations in many industries.
Over the years, we’ve observed a common pitfall in many CRO programs: a lack of dedicated technical resources.
This often leads to slow implementation and missed opportunities.
Before you run an A/B test, consider the following:
Why does it matter? Without the right technical skills or resources, A/B testing can quickly become a bottleneck.
Some tests need complex code changes or integrations with other tools, so it’s crucial to understand these needs from the start. This helps set realistic timelines, allocate resources wisely, and ensure your testing program runs smoothly.
Your first task in effective A/B testing is identifying potential website conversion problems.
Here’s a structured approach to building your “research opportunities” list:
Step #1 Gather enough data and insights:
Step #2. Build your research opportunities list:
Based on your research, you will end up with an extensive list of items you can test on your platform. We refer to this list as the “research opportunities.
For each item, include:
We will use these three points to prioritize items on the research opportunities list. Each item on the list includes additional data, such as the page it was identified on and the device type.
Step #3. Prioritize your list:
Not all tests are created equal. Prioritize your list based on factors like:
While your research opportunities list gives you a broad overview of potential areas for improvement, you’ll need to analyze data more deeply to prioritize your A/B tests effectively.
This involves analyzing both quantitative and qualitative data.
Quantitative analysis: unveiling traffic patterns and bottlenecks:
Before optimizing any page, understand how much traffic it receives. For example, if a page gets only 20% of visitors, optimizing it solely addresses 20% of potential improvements.
Utilize your web analytics to track user journeys and identify where users drop off.
For an e-commerce website, set up the following funnels/goals:
For a lead generation website, set up the following funnels/goals:
Each of these goals aims to start dissecting user behavior on the website. However, this quantitative research gives you half the picture—you need to conduct a qualitative analysis for more reliable data.
Qualitative analysis: Gaining user insights
Quantitative data helped you uncover what users are doing. Now, you must conduct a qualitative usability analysis to understand the why.
For qualitative analysis, gather feedback directly from users through:
Ask about their experiences, pain points, motivations, and what factors influenced their decisions to convert or abandon the website.
To determine which item to tackle first, prioritize your research opportunities list.
We use 18 factors to prioritize the research opportunities list (click here to download our prioritization sheet).
Our evaluation criterion includes:
Prioritizing items on the “research opportunities” list creates a six to eight-month conversion roadmap for the project.
This doesn’t mean optimization stops after this period—instead, you’ll repeat this process regularly to ensure ongoing improvement.
Here is a partial screen capture for a conversion roadmap on one of our CRO projects:

Don’t just guess—test with a hypothesis!
A hypothesis is a predictive statement about a possible change on the page and its impact on your conversion rate.
Each item on your prioritized research opportunities list should include an initial hypothesis—a starting point for addressing a potential problem. As you delve deeper into each issue, you’ll refine this initial hypothesis into a concrete, actionable one that you can use to design your test.
Example: Evolution of a Hypothesis
Notice how the concrete hypothesis is more specific and actionable. It:
A coherent, concrete hypothesis should drive every test you create. Avoid the temptation to change elements unrelated to your hypothesis, as this can muddy your results and make it difficult to draw meaningful conclusions.
To ensure your A/B test results are reliable, determine the minimum number of visitors required to achieve statistical significance.
This involves two key steps:
1. Determining unique visitors for the test pages:
Don’t assume all website visitors will encounter your test. Use your analytics to determine the total number of unique visitors going through the particular page(s) you plan to test in a month.
2. Determining how many visitors you must include in your test:
Before launching any split test, determine how many visitors must complete the test before you can draw statistically valid conclusions. This is called “fixed horizon testing,” and it ensures you don’t end your test prematurely or drag it on unnecessarily.
To calculate this, you’ll need the following information:
Many online calculators and statistical tools can help you determine the required sample size based on these inputs.

Why does this matter? Testing with an insufficient sample size can lead to inaccurate conclusions and wasted resources. By calculating the A/B test sample size upfront, you can ensure your test results are statistically significant and provide actionable insights for your optimization efforts.
Once you have a clearly defined hypothesis, the next step is to design a new page to validate it. However, be careful to avoid getting sidetracked by other design elements; focus solely on the changes related to your hypothesis.
Follow this simple two-step design process:
White your A/B testing software may allow you to create millions of variations for a single page; don’t go overboard with creating variations.
Validating each new variation requires a certain number of conversions. This approach of throwing things at the wall rarely works. Throwing multiple options at the wall and hoping something sticks is seldom a successful strategy. Instead, focus on creating a limited number of well-thought-out variations that address specific hypotheses.
Remember, the goal is to uncover sustainable and repeatable results. The more variations you introduce in a test, the harder it becomes to isolate the impact of each one.
For most websites, we recommend limiting the number of variations to less than seven. This simplifies analysis and reduces the risk of statistical errors.
You are not done when determining a winning design in a split test. A best practice is to run your original page against the winning design in a head-to-head (one-on-one) test.
Why Re-test?
A/B testing is an iterative process. Continuously validating your results will help you make data-driven decisions and optimize your website for maximum performance.
The real power of conversion optimization happens when you discover marketing insights from your testing to apply across verticals and channels.
Always look for actionable marketing insights from your test. These are excellent ways to proceed with your next test.
Follow these 11 best practices to transform your A/B testing process from a guessing game into a tool for conversion rate optimization. Remember, successful A/B testing is an ongoing journey of experimentation, learning, and optimization.
If you’re looking for expert guidance and support to unlock the full potential of A/B testing, Invesp’s team of seasoned CRO specialists is here to help.
A successful A/B test requires careful planning and execution.
It’s essential to have a team capable of designing effective test scenarios, analyzing results rigorously, and iterating based on learnings. Poorly designed experiments waste time and resources.
In this article, we’ll outline key steps to create successful A/B tests that drive meaningful results.
Before diving into testing, ensure you have clear criteria for deciding:
Remember, A/B testing is just one part of the larger conversion optimization process. It should ideally come after foundational work like:
This ensures your tests target the right areas and are informed by a deep understanding of your audience.
For a more in-depth guide on our CRO process, you might want to check out a more detailed guide on how we conduct conversion optimization projects.
Before considering elements on the page to test, start by analyzing different problem areas on your website. This helps prioritize your efforts and focus on changes that will have the most significant impact.
There are several conversion optimization methodologies available to guide your analysis. At Invesp, we utilize the Conversion Framework, which systematically examines seven key areas of a webpage:

The Conversion Framework analyzes seven different areas on the page:
These seven areas will influence whether visitors stay on your website or leave. Different elements have diverse impacts based on the type of page you are evaluating.
Using the Conversion Framework, a conversion optimization expert can quickly pinpoint 50 to 150 problems on a webpage.
However, attempting to fix all of them at once would be overwhelming and inefficient. Instead, prioritize and focus on the top three to seven problems to start. This targeted approach allows you to make meaningful improvements and gather data for further optimization.
A hypothesis is a predictive statement about the impact of removing or fixing one of the problems identified on a webpage.
For instance, our client selling nursing uniforms experienced high cart abandonment rates. Usability testing revealed visitors were price-conscious and feared overpaying.
Original Design: The initial shopping cart lacked clear assurances about price matching and money-back guarantees. This fueled visitor concerns.

Hypothesis: Adding prominent assurances to the cart page would reduce price concerns and decrease abandonment by 20%.
New Design: We introduced an “assurance center” on the left-hand navigation, highlighting the price match and money-back guarantees.

Results: This change led to a 30% reduction in cart abandonment, validating our hypothesis.
However, hypotheses aren’t universal.
A successful hypothesis for one website doesn’t guarantee success on another. A different client, also aiming to reduce cart abandonment, implemented a similar assurance center.
The image below shows the original design of the cart page:

The following image shows the new design of the cart page with the assurance center added to the left navigation:

Surprisingly, this change decreased conversions by 4%. Several factors could explain this: the design, copy, placement, or even a fundamental difference in their target audience.
Validating hypotheses through testing and refining them based on results is core to conversion optimization. In this case, further testing of the assurance center’s elements would be needed to determine its true impact.
Tests that increase conversions are great, but even those that decrease them offer valuable insights into visitor behavior and the accuracy of our hypotheses. The most concerning results are those that show no significant change, as they indicate a need for deeper analysis or a different approach.
Remember, each website and audience is unique. Continuous testing and refinement are crucial for uncovering what truly drives conversions for your specific context.
Once you have the hypothesis, the next step is to create new page designs to validate it.
Be careful when you are creating new designs. Do not go overboard with creating new variations. Most split-testing software allows you to create thousands, if not millions, of variations for a single page. You must remember that validating each new variation requires a certain number of conversions.
We limit page variations to less than seven for high-converting websites. We limit page variations for smaller sites to two or three new variations.
How do you judge the quality of the new designs you introduced to test your hypothesis? You let your visitors be the judge through AB or multivariate testing.
Remember the following procedures when conducting your tests:
A/B testing isn’t a one-time fix, but an ongoing process of learning and refinement. By systematically identifying problems, testing hypotheses, and creating data-driven variations, you can unlock valuable insights and continuously improve your website’s performance.
Remember, each website and audience is unique. There’s no one-size-fits-all solution. Through rigorous testing and data-driven decisions, you can tailor your website to your specific audience and achieve your conversion goals.
Need expert guidance to optimize your website for maximum conversions? Invesp’s team of conversion optimization specialists is here to help.
Did you know 75% of website visitors judge a site’s credibility based on its design?
This has led many business owners to believe that a site redesign will equal an astronomical increase in revenue.
But how true is that? Not very accurate.
A beautifully designed website is visually appealing (to the business execs and site visitors), but that’s not all there is to make sales on a website.
To see consistent sales, you need the right offers, messaging and to provide your website visitors with a positive user experience.
Now, how do you know which offer will work and which site design equals a great user experience?
Enter conversion rate optimization.
In simple terms, conversion rate optimization is about maximizing the potential of the traffic you already get on your website.
To successfully execute a CRO program on your site, you need tools. Every industry has specific tools and technologies, and CRO isn’t left out.
The issue is you can’t just use any CRO tool you see.
You need to consider some factors when considering your website’s CRO tools.
In this article, we’ll define a CRO tool, look at ten areas to evaluate CRO tools before deciding on the one you want to use for your business, and examples of CRO tools cutting across three categories.
Ready to learn something new?
Let’s dive in.
CRO tools help you collect information about your website visitors, their behaviors, and how they respond to changes you make on your site.
There are dozens of CRO tools out there. But they all fall under three categories:
If you want to know what’s going on on your site, in terms of numbers, then you should rely on web analytics tools. Since they only show you numbers, it’s safe to say that the web analytics tools only reveal the “what” and not the “why.”
Without knowing the “what“, it would be difficult to know where to start with the optimization process. And it would be difficult, if not impossible, to know about important metrics such as:
If you don’t understand why users behave as they do, you won’t be able to provide them with a better experience. This is where user behavior tools come into play.
User behavior tools are mainly used during qualitative user research, and they answer questions like;
CRO testing tools help you confirm if the site changes you want to make will positively or negatively impact your site conversions. They are useful for user research. Examples are Figpii, Google Optimize, etc.
In a nutshell, CRO tools help you;
Before deciding on a CRO tool for your Shopify store, you’ve got to have your business objectives in place.
According to Khalid Saleh, CEO of Invesp;
“You don’t start with choosing a CRO tool for your Store; you need to create a list of your business objectives that you want to accomplish over sometime. This list has to contain your must-haves, nice to have, and requirements that aren’t a priority to your business now.
When this is set, you can start looking for CRO tools to help you accomplish your objectives.
I always recommend having 4 to 5 tools that you run through a CRO tools checklist.”
Not every business is at the same CRO maturity level. On one extreme are companies aware of CRO but are yet to start any optimization program; on the other end are businesses with a culture of experimentation and CRO teams set up, e.g. Booking.

Before deciding on the CRO tools for your business, you need to identify your organization’s maturity level; this will help you choose the right tool for your business.
Nascent: these businesses are aware of CRO but are yet to commit to any program and dedicate resources.
Emerging: have resources available, understand the importance of CRO, started to run some tests but not consistently, yet to fully integrate conversion optimization into the business for the fear of failure.
Connected: have resources available, data-driven, have executive buy-in and actively push towards building a culture of experimentation across the business.
Multi-moment: you are very agile, have dedicated CRO teams, and have buy-in from C-level and senior management. CRO is part of your culture and is done routinely. You do not fear making mistakes but take pride in taking risks.
If you identify as Nascent, you’ll want to start with the basics – set up analytics to start tracking site data (if you’re yet to do so), set up surveys and polls to get direct feedback from site visitors, conduct some interviews for perspective (qualitative research), and get a tool that allows you to run A/B tests.
This process is because you end up with a bank of user issues, objections, and queries that you can go ahead to build your hypothesis, prioritize and test.
If you identify as emerging, that means you already have resources and are running some tests; all you need to do is answer the question – “do I have a CRO strategy in place?” “Are my tools too much to handle, or do I need something simpler to do the same work?”
The reason for not committing most time is because of a lack of structure ie, no CRO strategy, so you test anything that comes to mind.
Another reason is that it’s easy to feel overwhelmed with the tools, and dashboard and avoid CRO entirely.
If you identify as Connected:
Focus on tools: Find tools capable of the type of Personalization you need but also respect the users’ privacy.
Within the CRO discipline, some tools share similar features and functions that will fit into your CRO strategy.
Before deciding on the tool(s) to use for your optimization program, you have to consider pricing.
Here’s a scenario;
You’re looking for a tool that can run both A/B tests and Multivariate tests, gives insight into results, segment your audience and run personalized tests, etc.
Enter Tool A with these functions and other functions that aren’t important to you presently and Tool B with the same functions.
Tool A goes for $149 a month for all the functionality you’re looking for, while Tool B goes for $750.
Remember, it’s a hypothetical situation, and both tools match well in other aspects; which will you go with?
If you ask me, I’ll go with Tool A that’s at $149 monthly and save the change on top, which runs into thousands of dollars when calculated annually.
Back to reality – pricing is a crucial element when considering CRO tools. Don’t go for the priciest tool (pricey doesn’t always mean the best strategy fit); look around and see if there are other options that will carry out your CRO program but are less expensive.
I had a chat with Isabela, a CRO specialist from Invesp, and she suggested that:
“Before deciding on a CRO tool, you must factor in the price of said tool. Some CRO tools charge more based on your site’s traffic; others don’t bake the traffic factor into their pricing. What is most important is that the CRO tool meets your business needs.”
Amazon is a company that everyone recognizes has a fantastic customer service department.
One of my favorite quotes from Jeff Bezos is this:
“The most important single thing is to focus obsessively on the customer. Our goal is to be earth’s most customer-centric company.“
When picking a CRO tool, the availability of customer support should be a priority for you.
The reason is simple; you’ll run into issues where the tool malfunctions or doesn’t act as expected, and let’s assume you’ve got an A/B test on the line, quick response from the tool’s support will determine if that test goes through or falls flat.
Another perspective to look at support from is access to a knowledge base and documentation that make it easy to sort out significant issues yourself.
According to Khalid;
“When choosing a CRO tool, the availability of customer support isn’t a nice to have, but a must-have. The reason is that you’ll run into issues with some tools that only the devs on the tool’s side can help you with. This makes customer support necessary when evaluating which CRO tool to use.”
In essence, customer support is very critical when it comes to you either having a positive CRO program experience or a negative one, and the availability of support staff is good enough reason to choose a tool or not.
Here’s a question for you.
In the last three months, how many products (physical and digital) have you purchased without going through customer testimonials?
If you’re like me, not one.
I diligently comb through reviews to see how other users have used the product I want to get and their experience.
Going through customer testimonials is an essential step before choosing a CRO tool. If you skip this step and choose a tool, you might find yourself getting another tool soon.
According to Khalid, CEO of Invesp;
“Before deciding on a CRO tool, you want to ask around to know about the experience of users (past and present). Are they happy? Are they not satisfied? The responses you get are a good indicator if you should get a tool or not.”
There are two places you can get customer reviews;
Conversion rate optimization is about increasing your site’s conversion rate, but this will not be achieved if the CRO tools you choose make your site load slower and less responsive.
It’s essential you find out this because, according to a study, the conversion rate on a website drops 4.42% with every additional second it takes to load between 0 – 5 seconds.
To find out if a CRO tool will negatively impact your site performance, I suggest these two channels;
GDPR is a regulation that requires businesses to protect the personal data and privacy of EU citizens for transactions that occur within EU member states.
There’s a lot of user data analysis, interpretation, and application that comes with conversion rate optimization at every stage.
To be on the safe side which is on the side of the law, you want to make sure that the CRO tool you choose has a process to keep and protect customer data.
Pro tip: when you see a tool you like, check their website to see if they are GDPR compliant.

Every website has a tech stack, yours included.
In simple terms, a tech stack is a combination of tools, services, and applications used to build a website or app.
Before adding a CRO tool to your site’s tech stack, you want to ensure the tool you settle for can integrate with all or most of the tools you already have on your tech stack or it has an open API to build custom integrations.
The reason for this is to prevent;
CRO tools, like Figpii, VWO, and hotjar, offer an entire suite of conversion optimization tools that reduces the number of tools you need to have for a successful program.
Other tools like Nelio A/B testing just specialize in running standalone A/B tests, while user testing tools like Maze focus on just usability tests.
Your conversion optimization objective will determine if you should go for a tool that has a suite of tools or for a standalone tool that does that one thing that’s important to you.
Here’s a scenario to consider;
If all you’re interested in is A/B tests, not surveys, polls, or analytics, it’s a waste of resources to get a tool that offers every other feature plus A/B testing.
It serves you better to subscribe to a tool that runs A/B tests; this is how to save your resources.
According to Khalid;
“Some CRO tools are better than others regarding certain functionalities, while other tools provide a suite that does many things.
What it all boils down to are business objectives.
You need to answer the question of if you want to go with a tool that knocks other tools out of the park because it’s the best in an area or go for a tool that has a suite of functions that meets your CRO program needs.
If you decide to use a highly specialized tool, you’ll need to get other tools that fill up other functions. “
Isabela agrees;
“From my experience, some tools come loaded with many features that satisfy the requirements for a CRO program, while other tools have just a single feature. The most important factor here is your business objective before choosing a CRO tool. If you are running tests, need Personalization, or surveys, you’ll need a tool that has a suite of features. If you’re just concerned with only tests or surveys, go for a tool that has just that function..”
As your CRO program matures, you realize there are many ways to improve your site’s conversion, and one such way is Personalization.
Traditional A/B tests provide you with a one size fits all result.
Consider this scenario;
You test a variation of a landing page against a control.
Let’s call the variation page A and the control page B.
Page A gets a 60% conversion uplift, while the control (page B) is at 40%.

On average, Page A performs better, but here’s where there will be a problem.
Not every website visitor is the same, which means you’ll miss out on a bunch of conversions because the winning page A doesn’t sit well with every site visitor on your website.
To achieve better conversions at scale, you need to split your audience into segments based on several characteristics and show them personalized pages, offers, etc.
The truth is, Personalization isn’t a nice to have, but vital aspect of any CRO program if you want to see conversions at scale.
Another fact is not every CRO tool has personalization capabilities.
So, If Personalization is vital in your CRO program now or in the long term, you want to consider a tool that supports Personalization.
When selecting a CRO tool, make sure it offers an integrated dashboard where it’s easy to locate the CRO features you and your team need.
Also, a user-friendly dashboard allows cross-team collaboration ie, members of your team can come in, see which tests are running, set up tests or surveys, etc.
In the first section, where I defined a CRO tool, I broke down CRO tools into three categories. This section will look at different tools under each category, what makes them unique, and their pricing.

Best For: Tracking website metrics & visit data
Suitable For: Small to big companies
Supports 3rd party integration: Yes
Google Analytics lets you see how your site is performing across different metrics such as unique visits, page bounce rate, page value, etc
GA is a popular tool amongst CRO specialists because;
Pros
Cons
Price: Free

Best For: Website analytics, behavior analysis, heatmaps, session replays
Suitable For: Small to big businesses
Supports 3rd party integration: Yes
Full Story is a digital experience intelligence platform that provides more insights than website analytics to give you a complete picture of users’ experiences. From real-time website user insights to issues and bugs, the tool makes it possible to identify the friction points to aid your optimization strategies.
Here are some of the features of Fullstory that make it stand out;
Pros
Cons
Price: available on request

Best For: Product analytics, behavioral analysis
Suitable For: Small to big businesses
Supports 3rd party integration: Yes
Mixpanel is an analytics tool that helps you unlock valuable customer insights. Mixpanel provides you with data-rich dashboards to get a detailed view of user-based events in your products.
Here are some features that make Mixpael an exciting tool to work with;
Pros
Cons
Price: there’s the free option, the growth plan that starts at $25, and the enterprise available on request.

Best For: AB tests, polls and surveys, heatmaps, session recordings
Suitable For: Small to big businesses
Supports 3rd party integration: Yes
Designed by CRO specialists, figpii offers a full suite of CRO tools. It’s my first choice as a tool for understanding user behavior because, with it, you can conduct surveys and polls, watch session recordings to see how users interact with your site elements, etc.
Pros
Cons
Price: Free for up to 75,000 visitors per month

Best For: Heatmaps, session replays, surveys,
Suitable For: Small to big business
Supports 3rd party integration: Yes
Hotjar is a leading website optimization tool for user behavioral data analysis.
Here are some features that make hotjar one of the most advanced conversion optimization tools around;
Pros
Cons
Price: there is basic, which is free forever, then there’s the plus plan which is $32, the business plan which is $80, and the scale plan, which is available on request.

Best For: Heatmaps, session replays, form analysis, surveys
Suitable For: Small to big businesses
Supports 3rd party integration: Yes
Lucky orange is a conversion optimization tool that helps you understand user behavior better.
It has heat maps and session recordings for unbiased user behavior analysis.
Here are some of the features that make it stand out as a data analysis tool;
Pros
Cons
Price: there is a free plan, then there’s a build plan at $14, grow plan at $28, expand plan at $58, and scale plan at $128
We have already mentioned FigPii in the section about behavior analysis tools. But it’s important to also mention that FigPii also has an incredible AB testing engine that is faster than most tools in this list. A fast AB testing tool means little flicker effect, and as you may (or may not) know, flicker effects can have a negative impact on the user experience.

Best For: Run A/B tests on your website, app, or product
Suitable For: Small to big companies
Supports 3rd party integration: Yes
AB tasty is a conversion optimization tool that allows you to run tests without the help of developers.
It also has in-depth targeting options that allow you to segment site users and provide personalized experiences for them
Here are some of the features of AB tasty;
Pros
Cons
Price: available on request

Best For: A/B testing, experience personalization, heatmaps, session recordings, surveys
Suitable For: Medium to large enterprises
Supports 3rd party integration: Yes
It’s one of the leading CRO tools used chiefly by medium to large enterprises. VWO provides client-side and server-side testing, and it comes with an inbuilt behavioral analysis tool.
Here are some of VWO’s leading features;
Pros
Cons
Price: available on request

Best For: A/B testing, AI-based Personalization
Suitable For: Small to big businesses
Supports 3rd party integration: Yes
Concerning A/B tests and other types of tests in CRO, Kameleoon is full stack.
Not just that, it has advanced machine learning algorithms that calculate each visitor’s conversion possibilities in real-time.
Here are some of the features that make CRO specialists use Kameleoon;
Pros
Cons
Price: available on request
Abracadabra, you wave your hands, and your store sales go up.
That’s not possible, and it’s never going to happen.
To see a consistent increase in your store sales means you want to take conversion rate optimization seriously, and to do CRO, you need the right tools.
This checklist isn’t meant to be an exhaustive list for evaluating CRO tools but to help make your selection decision more straightforward.
Following the steps outlined in this article, you definitely will be working a safe path.