Maximize Your Website’s Potential: Your ultimate guide to boost conversions, improve user experience, increase search engine rankings, and skyrocket e-commerce sales.
Join our community of digital marketers and entrepreneurs for proven strategies and data-driven insights.
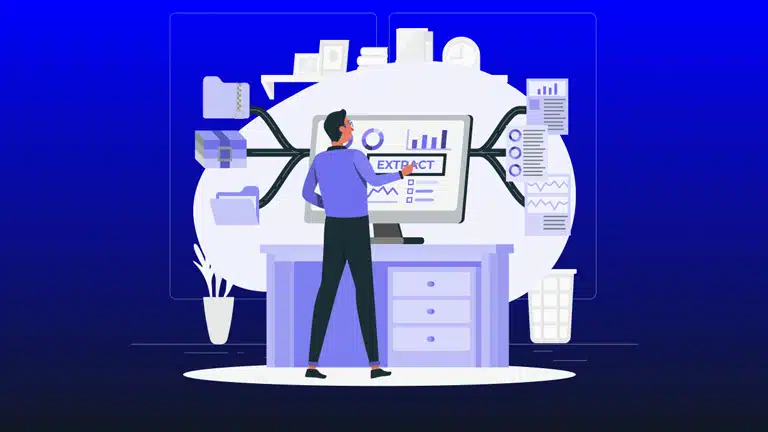
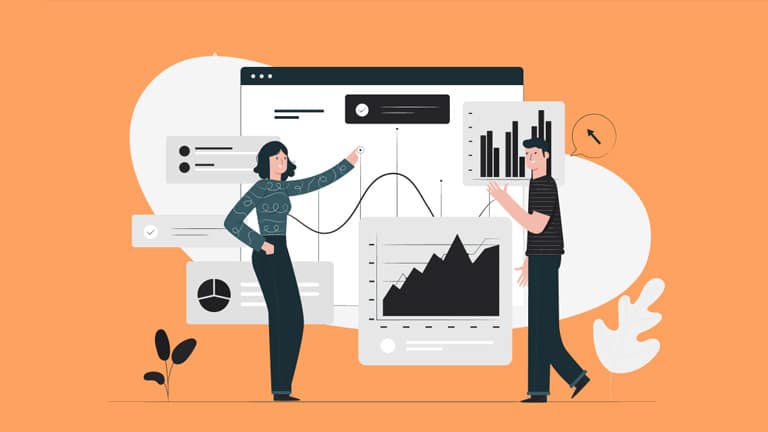
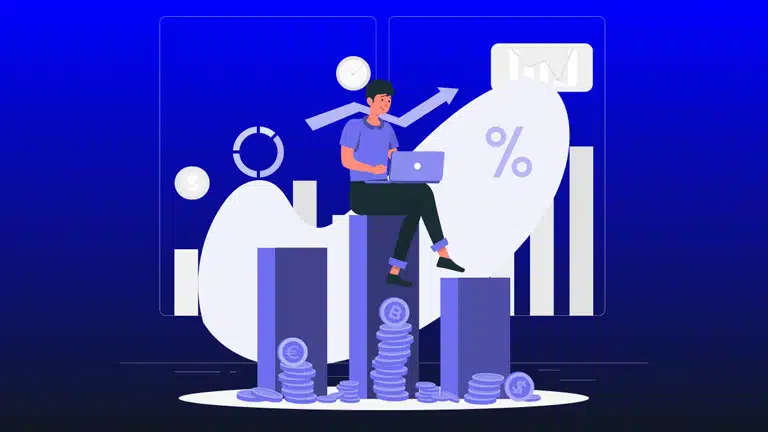
Reading Time: 6minutesConversion rate optimization is a science. This means you should be able to reproduce a process, step by step, through a time-tested system, to achieve the increase in conversions you aspire for your website. Sounds good, right? That is why we created the Conversion Framework. The goal of the Conversion Framework is to remove the guesswork from the conversion optimization […]